Bullish Symmetrical Triangle
was formed on 08.04 at 14:47:55 (UTC+0)
signal strength 3 of 5
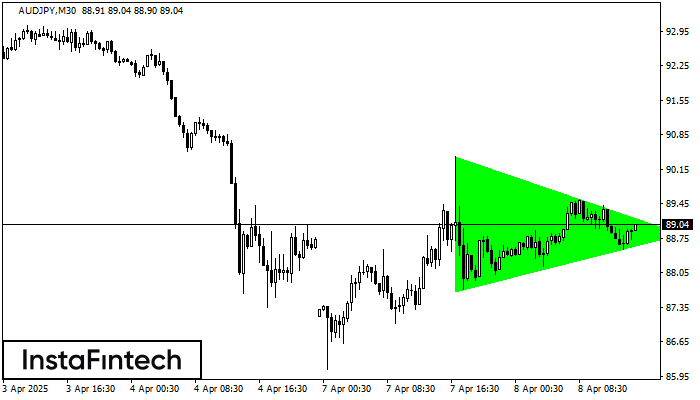
According to the chart of M30, AUDJPY formed the Bullish Symmetrical Triangle pattern. Description: This is the pattern of a trend continuation. 90.41 and 87.68 are the coordinates of the upper and lower borders respectively. The pattern width is measured on the chart at 273 pips. Outlook: If the upper border 90.41 is broken, the price is likely to continue its move by 89.12.
ดูเพิ่มเติม
- All
- All
- Bearish Rectangle
- Bearish Symmetrical Triangle
- Bullish Rectangle
- Double Top
- Double Top
- Triple Bottom
- Triple Bottom
- Triple Top
- Triple Top
- All
- All
- Buy
- Sale
- All
- 1
- 2
- 3
- 4
- 5
Panji Bullish
was formed on 18.06 at 19:31:52 (UTC+0)
signal strength 3 of 5
Sinyal Panji Bullish – instrumen trading #NTDOY M30, pola kelanjutan. Prakiraan: mungkin untuk mengatur posisi beli di atas titik tertinggi pola, di 22.88, dengan prospek pergerakan selanjutnya menjadi proyeksi titik
Open chart in a new window
Panji Bullish
was formed on 18.06 at 19:31:50 (UTC+0)
signal strength 3 of 5
Sinyal Panji Bullish – instrumen trading #NTDOY M30, pola kelanjutan. Prakiraan: mungkin untuk mengatur posisi beli di atas titik tertinggi pola, di 22.88, dengan prospek pergerakan selanjutnya menjadi proyeksi titik
Open chart in a new window
Bawah Triple
was formed on 18.06 at 19:10:16 (UTC+0)
signal strength 1 of 5
Pola Bawah Triple telah terbentuk pada grafik EURNZD M5. Fitur-fitur pola: garis bawah pola memiliki koordinat 1.9064 dengan batas atas 1.9064/1.9063, proyeksi lebar adalah 22 poin. Pembentukan pola Bawah Triple
Rangka waktu M5 dan M15 mungkin memiliki lebih dari titik entri yang keliru.
Open chart in a new window