Double Top
was formed on 01.06 at 01:00:35 (UTC+0)
signal strength 3 of 5
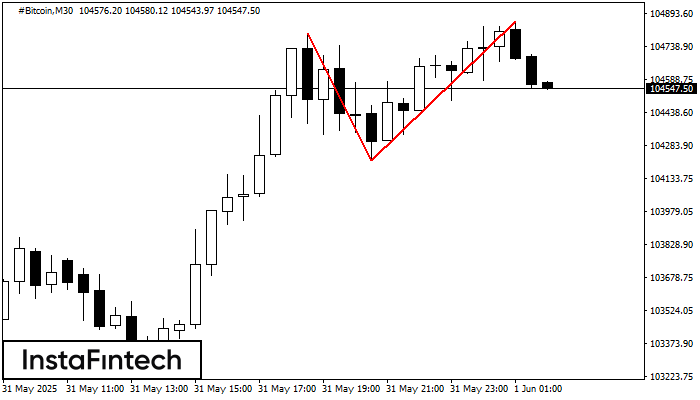
The Double Top reversal pattern has been formed on #Bitcoin M30. Characteristics: the upper boundary 104800.13; the lower boundary 104215.56; the width of the pattern is 64024 points. Sell trades are better to be opened below the lower boundary 104215.56 with a possible movements towards the 104215.30 level.
ดูเพิ่มเติม
- All
- All
- Bearish Rectangle
- Bearish Symmetrical Triangle
- Bullish Rectangle
- Double Top
- Double Top
- Triple Bottom
- Triple Bottom
- Triple Top
- Triple Top
- All
- All
- Buy
- Sale
- All
- 1
- 2
- 3
- 4
- 5
รูปแบบกราฟจุดสามยอดขาลง (Triple Bottom)
was formed on 12.06 at 20:55:28 (UTC+0)
signal strength 1 of 5
รูปแบบ รูปแบบกราฟจุดสามยอดขาลง (Triple Bottom) ได้ถูกสร้างขึ้นมาใน EURJPY M5 มันมี คุณลักษณะ ดังต่อไปนี้: ระดับแนวต้าน 166.25/166.16; ระดับของแนวรับ 166.09/166.09; ความกว้างคือ
ขอบเตระยะเวลาใน M5 และ M15 อาจจะมีตำแหน่งการเข้าใช้งานที่ผิดพลาดมากยิ่งขึ้น
Open chart in a new window
รูปแบบกราฟจุดสามยอดขาลง (Triple Bottom)
was formed on 12.06 at 20:25:49 (UTC+0)
signal strength 1 of 5
รูปแบบ รูปแบบกราฟจุดสามยอดขาลง (Triple Bottom) ได้ถูกสร้างขึ้นมาใน EURCAD M5 มันมี คุณลักษณะ ดังต่อไปนี้: ระดับแนวต้าน 1.5771/1.5752; ระดับของแนวรับ 1.5748/1.5738; ความกว้างคือ
ขอบเตระยะเวลาใน M5 และ M15 อาจจะมีตำแหน่งการเข้าใช้งานที่ผิดพลาดมากยิ่งขึ้น
Open chart in a new window
รูปแบบกราฟธงขาลง (Bearish Flag)
was formed on 12.06 at 20:23:26 (UTC+0)
signal strength 1 of 5
รูปแบบ รูปแบบกราฟธงขาลง (Bearish Flag) ได้ถูกสร้างขึ้นมาใน GBPCHF ที่ M5 ขอบเขตด้านล่างของรูปแบบนี้จะอยุ่ใน 1.1026/1.1032 ขณะที่ขอบเขตด้านบนอยู่ใน 1.1030/1.1036 ตัวของเสาธงอยู่ที่ 15 จุด
ขอบเตระยะเวลาใน M5 และ M15 อาจจะมีตำแหน่งการเข้าใช้งานที่ผิดพลาดมากยิ่งขึ้น
Open chart in a new window