empty

Inverse Head and Shoulder
was formed on 12.06 at 12:30:08 (UTC+0)
signal strength 2 of 5

Inverse Head and Shoulder NZDCAD M15

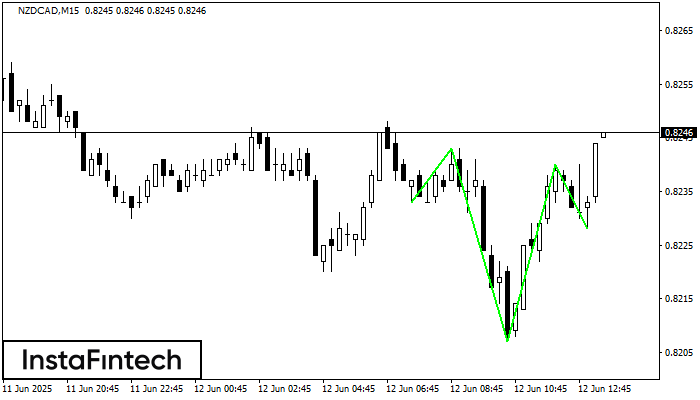
According to the chart of M15, NZDCAD produced the pattern termed the Inverse Head and Shoulder. The Head is fixed at 0.8207 while the median line of the Neck is set at 0.8243/0.8240. The formation of the Inverse Head and Shoulder Pattern clearly indicates a reversal of the downward trend. In means that in case the scenario comes true, the price of NZDCAD will go towards 0.8263.

The M5 and M15 time frames may have more false entry points.

ดูเพิ่มเติม

Figure
  • All
Instrument
  • All
  • Bearish Rectangle
  • Bearish Symmetrical Triangle
  • Bearish Symmetrical Triangle
  • Bullish Rectangle
  • Double Top
  • Double Top
  • Triple Bottom
  • Triple Bottom
  • Triple Top
  • Triple Top
Timeframe
  • All
Trend
  • All
  • Buy
  • Sale
Signal Strength
  • All
  • 1
  • 2
  • 3
  • 4
  • 5

รูปแบบกราฟหัวและหัวไหล่ (Head and Shoulders)
was formed on 23.07 at 21:36:38 (UTC+0)
signal strength 1 of 5

รูปแบบกราฟหัวและหัวไหล่ (Head and Shoulders) #NTDOY M5

รูปแบบทางเทคนิค ทำให้เกิด รูปแบบกราฟหัวและหัวไหล่ (Head and Shoulders) ที่ปรากฎออกมาในชาร์ตของ #NTDOY M5 มีเหตุผลที่หนักแน่นอยู่หลายประการที่แสดงให้เห็นว่า ราคาจะมุ่งหน้าผ่านตำแหน่งส่วนคอ 22.12/22.12 หลังจากตำแหน่งส่วนหัวไหล่ด้านขวาได้ถูกสร้างขึ้นมา ดังนั้นแนวโน้มจะมีการเปลี่ยนแปลงพร้อมกับราคาที่จะมุ่งหน้าไปยัง21.97

ขอบเตระยะเวลาใน M5 และ M15 อาจจะมีตำแหน่งการเข้าใช้งานที่ผิดพลาดมากยิ่งขึ้น

Open chart in a new window

รูปแบบกราฟหัวและหัวไหล่ (Head and Shoulders)
was formed on 23.07 at 21:36:33 (UTC+0)
signal strength 1 of 5

รูปแบบกราฟหัวและหัวไหล่ (Head and Shoulders) #NTDOY M5

#NTDOY M5 ได้สร้างรูปแบบ รูปแบบกราฟหัวและหัวไหล่ (Head and Shoulders) พร้อมกับคุณลักษณะดังต่อไปนี้ : ระดับสูงของตำแหน่งหัวอยู่ที่ 22.21, ตำแหน่งคอ และมุมขาขึ้นอยู่ที่ 22.12/22.12 การก่อตัวของรูปแบบเช่นนี้

ขอบเตระยะเวลาใน M5 และ M15 อาจจะมีตำแหน่งการเข้าใช้งานที่ผิดพลาดมากยิ่งขึ้น

Open chart in a new window

รูปแบบกราฟสี่เหลี่ยมผืนผ้าขาขึ้น (Bullish Rectangle)
was formed on 23.07 at 20:33:19 (UTC+0)
signal strength 3 of 5

รูปแบบกราฟสี่เหลี่ยมผืนผ้าขาขึ้น (Bullish Rectangle) #TSLA M30

อ้างอิงจากชาร์ตของ M30, #TSLA ที่ได้สร้างรูปแบบ รูปแบบกราฟสี่เหลี่ยมผืนผ้าขาขึ้น (Bullish Rectangle) ออกมา ซึ่งเป็นรูปแบบของความต่อเนื่องในแนวโน้ม รูปแบบนี้จะอยู่ในขอบเขตตามนี้: ขอบเขตด้านล่าง 328.44 – 328.44

Open chart in a new window
หากไม่สะดวกคุยในตอนนี้
ระบุคำถามไว้ได้ใน แชท.
 

Dear visitor,

Your IP address shows that you are currently located in the USA. If you are a resident of the United States, you are prohibited from using the services of InstaFintech Group including online trading, online transfers, deposit/withdrawal of funds, etc.

If you think you are seeing this message by mistake and your location is not the US, kindly proceed to the website. Otherwise, you must leave the website in order to comply with government restrictions.

Why does your IP address show your location as the USA?

  • - you are using a VPN provided by a hosting company based in the United States;
  • - your IP does not have proper WHOIS records;
  • - an error occurred in the WHOIS geolocation database.

Please confirm whether you are a US resident or not by clicking the relevant button below. If you choose the wrong option, being a US resident, you will not be able to open an account with InstaTrade anyway.

We are sorry for any inconvenience caused by this message.