

Актуальні патерни

Патерни - це графічні моделі, які "малюють" ціни на графіку. Один з постулатів технічного аналізу говорить нам про те, що історія (рух ціни) завжди повторюється. Це означає, що в схожих ситуаціях рух ціни, найчастіше, буде схожим, що дозволяє з високою часткою ймовірності спрогнозувати подальший розвиток ситуації.
Актуальні патерни від ІнстаФорекс - це зручний сервіс, який дозволить вам завжди бути в курсі останніх змін на ринку і вчасно реагувати на підказки, що з'явилися, від ринку. У нашому сервісі ви завжди знайдете найсвіжіші і актуальніші патерни на будь-якій парі і на будь-якому таймфреймі.
Двойная вершина
сформирован 04.06 в 03:30:07 (UTC+0)
сила сигнала 3 из 5
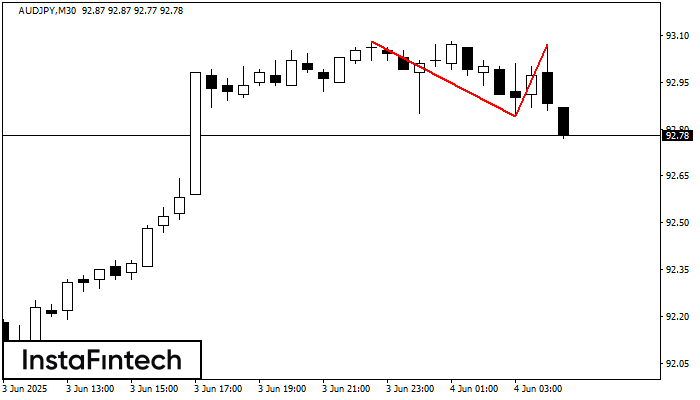
На торговом графике AUDJPY M30 сформировалась разворотная фигура «Двойная вершина». Характеристика: Верхняя граница 93.07; Нижняя граница 92.84; Ширина фигуры 23 пунктов. Сигнал: Пробой нижней границы 92.84 приведет к дальнейшему нисходящему движению с перспективой хода к уровню 92.54.


