

Актуальні патерни

Патерни - це графічні моделі, які "малюють" ціни на графіку. Один з постулатів технічного аналізу говорить нам про те, що історія (рух ціни) завжди повторюється. Це означає, що в схожих ситуаціях рух ціни, найчастіше, буде схожим, що дозволяє з високою часткою ймовірності спрогнозувати подальший розвиток ситуації.
Актуальні патерни від ІнстаФорекс - це зручний сервіс, який дозволить вам завжди бути в курсі останніх змін на ринку і вчасно реагувати на підказки, що з'явилися, від ринку. У нашому сервісі ви завжди знайдете найсвіжіші і актуальніші патерни на будь-якій парі і на будь-якому таймфреймі.
Тройная вершина
сформирован 13.06 в 07:45:25 (UTC+0)
сила сигнала 1 из 5
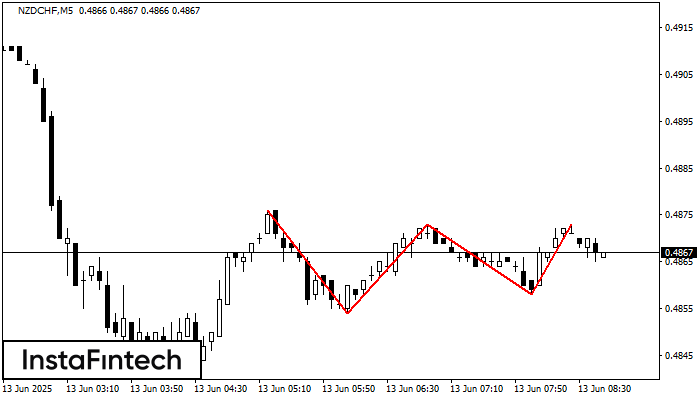
На графике NZDCHF M5 образовалась фигура «Тройная вершина». Данная фигура относится к типу разворотных и имеет характеристику: Верхняя граница 0.4876/0.4873; Нижняя граница 0.4854/0.4858; Ширина фигуры 15 пунктов. Прогноз: В случае пробоя нижней границы 0.4854 вероятно дальнейшее нисходящее движение к уровню 0.4858.
Таймфреймы М5 и М15 могут иметь больше ложных точек входа.


