

Актуальні патерни

Патерни - це графічні моделі, які "малюють" ціни на графіку. Один з постулатів технічного аналізу говорить нам про те, що історія (рух ціни) завжди повторюється. Це означає, що в схожих ситуаціях рух ціни, найчастіше, буде схожим, що дозволяє з високою часткою ймовірності спрогнозувати подальший розвиток ситуації.
Актуальні патерни від ІнстаФорекс - це зручний сервіс, який дозволить вам завжди бути в курсі останніх змін на ринку і вчасно реагувати на підказки, що з'явилися, від ринку. У нашому сервісі ви завжди знайдете найсвіжіші і актуальніші патерни на будь-якій парі і на будь-якому таймфреймі.
Бычий симметричный треугольник
сформирован 13.06 в 19:35:08 (UTC+0)
сила сигнала 1 из 5
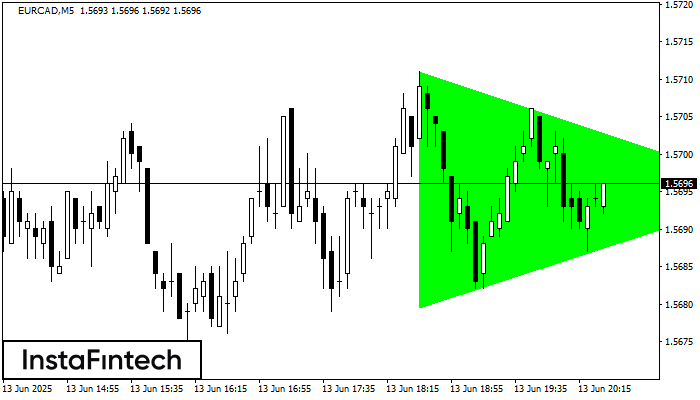
По EURCAD на M5 сформировалась фигура «Бычий симметричный треугольник», которая сигнализирует нам о продолжении тенденции. Характеристика: Верхняя граница фигуры имеет координаты 1.5711/1.5695; Нижняя граница 1.5680/1.5695; Проекция ширины фигуры 31 пунктов. Формирование фигуры «Бычий симметричный треугольник» на восходящем тренде свидетельствует о продолжении текущего движения, где, в случае пробоя значения 1.5695, возможно движение к 1.5710.
Таймфреймы М5 и М15 могут иметь больше ложных точек входа.


