Xem thêm

 22.03.2023 07:37 AM
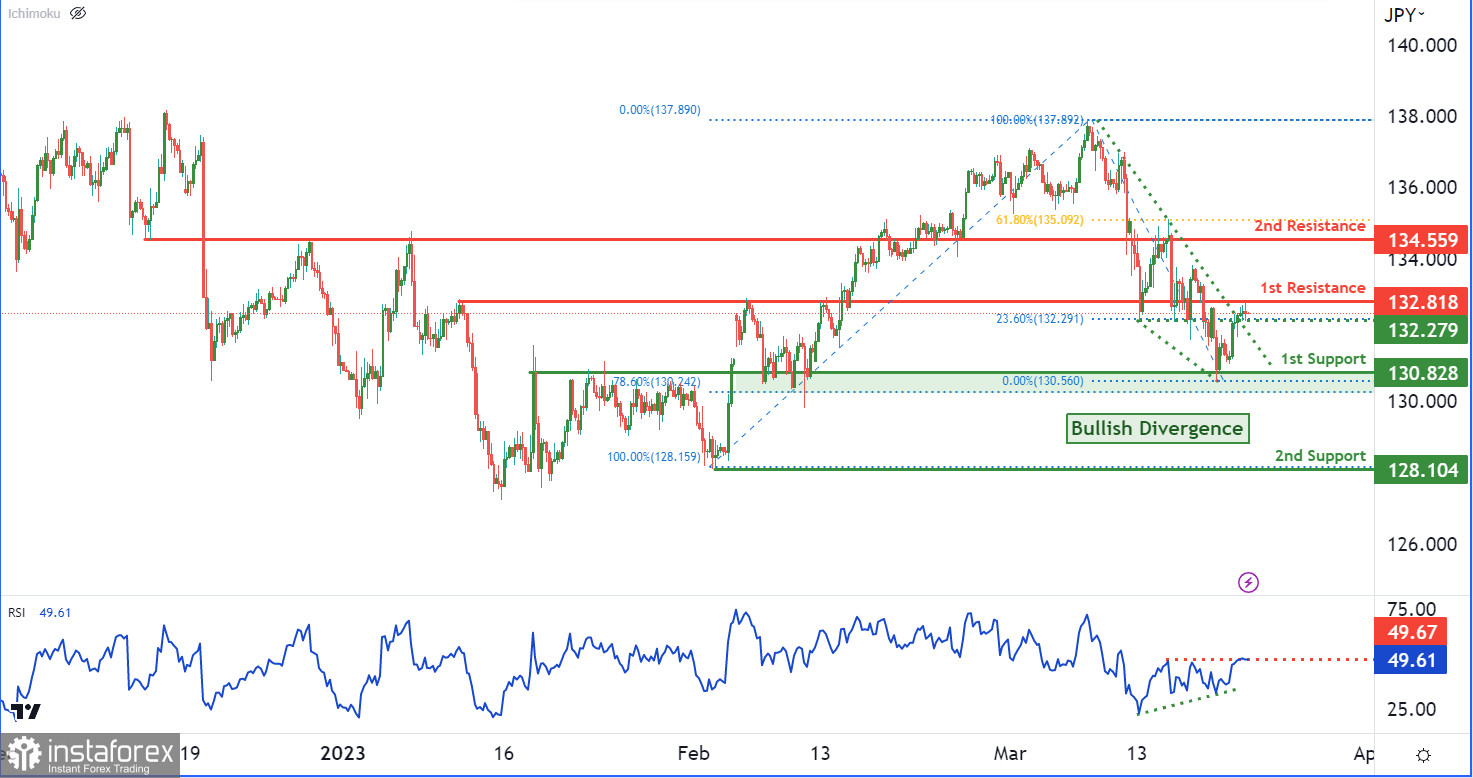
The USD/JPY chart currently reflects a bullish momentum as it is trading above a significant ascending trend line, indicating potential for further bullish movement. In case the price manages to break the 1st resistance level, it could advance towards the 2nd resistance level.
The 1st support level is located at 130.82, representing a robust overlap support and also coincides with the 78.60% Fibonacci retracement level. Additionally, the 2nd support level is situated at 128.10, which is a multi-swing low support level that has previously acted as a reliable support.
On the resistance side, the 1st level lies at 132.81, displaying an overlap resistance and also aligns with the 23.60% Fibonacci retracement level. The 2nd resistance level is at 134.55, representing an overlap resistance level with confluence at the 61.80% Fibonacci retracement level.
It is essential to consider that the RSI is currently exhibiting bullish divergence in contrast to price action, indicating a potential bounce in the near future.
You have already liked this post today
*Phân tích thị trường được đăng tải ở đây có nghĩa là để gia tăng nhận thức của bạn, nhưng không đưa ra các chỉ dẫn để thực hiện một giao dịch.

