Xem thêm

 24.03.2023 07:09 AM
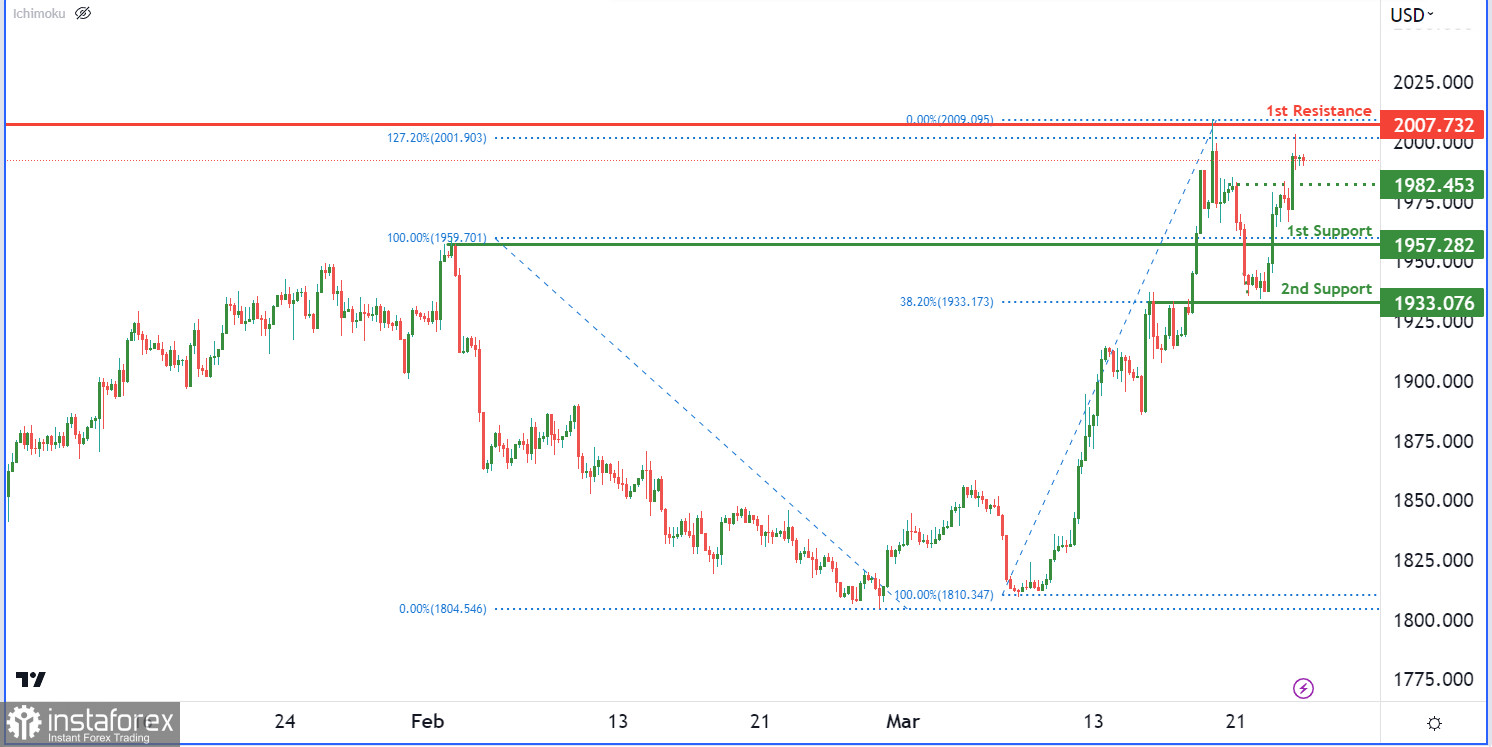
The XAU/USD chart currently has a bearish momentum, with potential for a bearish reaction off the first resistance level at 2007 and a drop towards the first support level at 1957. This support level has held prices up before and if broken, the price could drop towards the second support level at 1933. On the resistance side, the first resistance level is at 2007 with a 127% Fibonacci extension. An intermediate support level at 1982 could act as a pullback support if the price drops.
You have already liked this post today
*Phân tích thị trường được đăng tải ở đây có nghĩa là để gia tăng nhận thức của bạn, nhưng không đưa ra các chỉ dẫn để thực hiện một giao dịch.

