



النماذج الفعلية

النماذج هي نماذج رسومية تتشكل في الرسم البياني حسب السعر. وفقا لأحد المسلمات التحليلية الفنية، فإن التاريخ (حركة السعر) يكرر نفسه. ويعني ذلك أن حركات الأسعار غالباً ما تكون متشابهة في نفس الأوضاع مما يجعل من الممكن التنبؤ بزيادة تطوير الوضع الذي يتسم باحتمال كبير.
النماذج ذات الصلة المقدمة من قبل إنستافوركس هي خدمة سهلة الاستخدام تسمح لك بمعرفة التغييرات الأخيرة في السوق والرد على الأدلة من السوق في الوقت المناسب. في خدمتنا، ستجد دائمًا النماذج الأكثر حداثة وملاءمة في أي زوج وأي إطار زمني.
Double Bottom
was formed on 26.08 at 14:24:37 (UTC+0)
signal strength 1 of 5
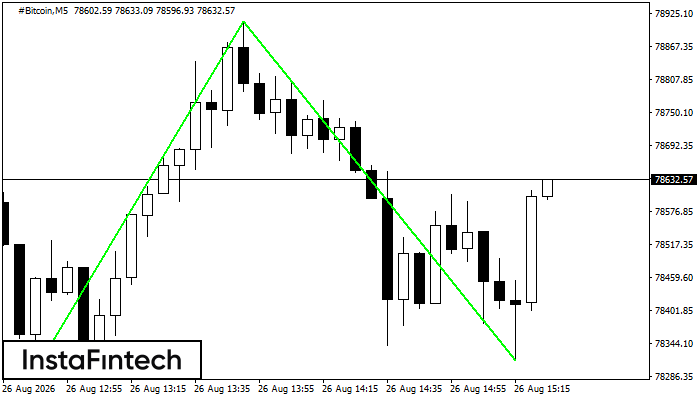
The Double Bottom pattern has formed on the #Bitcoin M5 chart. Its upper boundary is at 78910.69, its lower boundary is at 78313.32, and its width is 61418 points. A break above the upper boundary at 78910.69 may confirm a trend reversal, with the pattern width defining the projected distance to a potential Take Profit level.
The M5 and M15 time frames may generate more false entry signals.

