Lihat juga
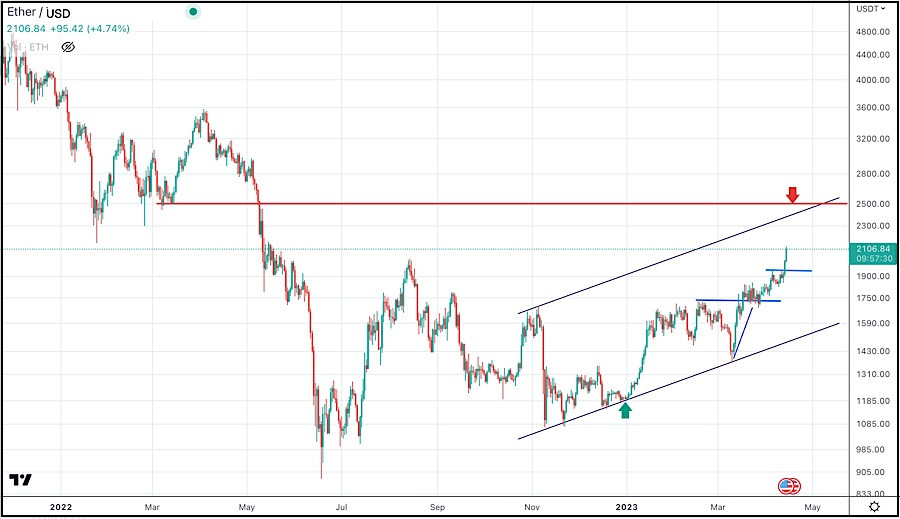
Ethereum has been one of the best-performing cryptocurrencies in the market, with significant gains since the beginning of the year. The recent technical analysis of the Ethereum/USD chart shows a potential bullish trend in the near future.
The updated technical analysis of the Ethereum/USD chart indicates that Ethereum has broken out of a key resistance level against USD, which could lead to further gains.
The cryptocurrency is trading within an ascending channel on the USD chart, signaling a potential bullish move.
Ethereum is trading above its 50-day moving average, indicating a bullish trend. However, the Relative Strength Index (RSI) is approaching overbought levels, which indicates a potential correction.
Hence, Ethereum may experience a pullback before continuing its upward trend against USD.
Traders should keep an eye on the price action around the 2500$ level, as it is a key resistance level. A break above this level could lead to further gains towards the 3000$ level. Conversely, a break below the 2000 $ support level could lead to a short-term bearish trend.
In summary, Ethereum against USD chart points to further continuation of the ongoing bullish trend, with a key resistance level at 2500.
Traders should be cautious and wait for confirmation of the bullish trend before entering any long positions.
You have already liked this post today
*Analisis pasar yang diposting disini dimaksudkan untuk meningkatkan pengetahuan Anda namun tidak untuk memberi instruksi trading.
Pada hari Kamis, pasangan EUR/USD melanjutkan pergerakan naiknya dan berkonsolidasi di atas level retracement Fibonacci 100,0% di 1,1574. Namun, pada malam hari, terbentuk reversal tajam yang menguntungkan dolar AS, dengan
Selamat siang, para trader yang terhormat! Pada hari Rabu, pasangan EUR/USD melanjutkan pergerakan naiknya setelah memantul dari zona support 1,1374–1,1380. Pasangan ini berhasil berkonsolidasi di atas level retracement Fibonacci 76,4%
Pada chart 4 jam dari indeks Nasdaq 100, nampak terlihat Divergensi antara pergerakan harganya dengan indikator Stochastic Oscillator, terutama ditambah dengan konfirmasi saat ini dari pergerakan harga #NDX yang bergerak
Bila Kita perhatikan chart harian dari instrumen komoditi Minyak Mentah, nampak muncul Divergensi antara pergerakan harga #CL dengan indikator Stochastic Oscillator, dimana ini merupakan petunjuk kalau ada kemungkinan #CL dalam
Jika harga euro jatuh di bawah 1,1500 dalam beberapa jam ke depan, ini bisa dianggap sebagai kesempatan untuk menjual. Secara teknis, pasangan ini tampaknya sudah overbought pada grafik
Tren XAU/USD tetap bullish selama harga terkonsolidasi di atas 3,331. Oleh karena itu, akan bijaksana untuk membeli emas selama harga terkonsolidasi di atas 3,359, di mana level 7/8 Murray berada
Your IP address shows that you are currently located in the USA. If you are a resident of the United States, you are prohibited from using the services of InstaFintech Group including online trading, online transfers, deposit/withdrawal of funds, etc.
If you think you are seeing this message by mistake and your location is not the US, kindly proceed to the website. Otherwise, you must leave the website in order to comply with government restrictions.
Why does your IP address show your location as the USA?
Please confirm whether you are a US resident or not by clicking the relevant button below. If you choose the wrong option, being a US resident, you will not be able to open an account with InstaTrade anyway.
We are sorry for any inconvenience caused by this message.