Lihat juga
Ethereum has been one of the best-performing cryptocurrencies in the market, with significant gains since the beginning of the year. The recent technical analysis of the Ethereum/USD chart shows a potential bullish trend in the near future.
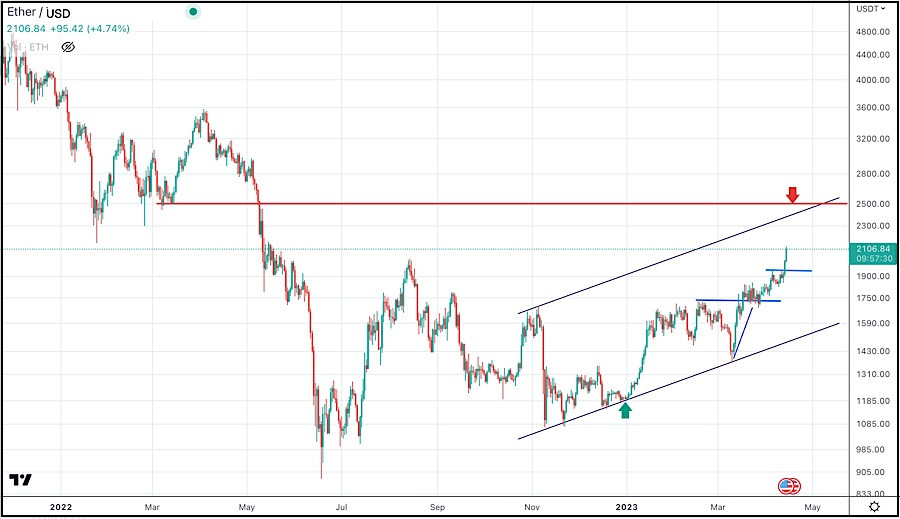
The updated technical analysis of the Ethereum/USD chart indicates that Ethereum has broken out of a key resistance level against USD, which could lead to further gains.
The cryptocurrency is trading within an ascending channel on the USD chart, signaling a potential bullish move.
Ethereum is trading above its 50-day moving average, indicating a bullish trend. However, the Relative Strength Index (RSI) is approaching overbought levels, which indicates a potential correction.
Hence, Ethereum may experience a pullback before continuing its upward trend against USD.
Traders should keep an eye on the price action around the 2500$ level, as it is a key resistance level. A break above this level could lead to further gains towards the 3000$ level. Conversely, a break below the 2000 $ support level could lead to a short-term bearish trend.
In summary, Ethereum against USD chart points to further continuation of the ongoing bullish trend, with a key resistance level at 2500.
Traders should be cautious and wait for confirmation of the bullish trend before entering any long positions.
You have already liked this post today
* Analisis pasaran yang disiarkan di sini adalah bertujuan untuk meningkatkan kesedaran anda, tetapi tidak untuk memberi arahan untuk membuat perdagangan.
Jika kita melihat pada carta 4 jam, pasangan mata wang silang GBP/JPY dilihat bergerak dalam kecenderungan menaik, yang disahkan oleh pergerakan harga yang bergerak dalam saluran Menaik ke atas
Pada carta 4-jam, instrumen komoditi Emas menunjukkan wujudnya Perbezaan antara pergerakan harga Emas dan penunjuk Pengayun Stochastic, yang menandakan bahawa dalam masa terdekat Emas berpotensi untuk melemah bagi menguji paras
Euro terus menunjukkan ketahanan walaupun berdepan dengan risiko geopolitik, namun ia tidak berlaku secara bersendirian. Kekuatan ini disokong oleh harga minyak dan penyatuan teknikal dalam pasaran saham, mencerminkan korelasi yang
Emas kini sedang berpegang pada kerugian harian. Secara keseluruhan, sentimen positif di pasaran saham sedang melemahkan permintaan untuk logam berharga ini. Walau bagaimanapun, gabungan beberapa faktor sedang menghalang pasaran menurun
Pada carta mengikut jam, pasangan GBP/USD pada hari Jumaat melantun semula dua kali dari tahap penarikan semula Fibonacci 127.2% di 1.3527 dan meningkat menuju zon rintangan 1.3611–1.3633. Walau bagaimanapun, sebelum
Dengan kemunculan corak Bullish 123 di tengah-tengah keadaan penyusutan pada pasangan mata wang eksotik ini, yang telah disahkan oleh pergerakan harga USD/IDR yang bergerak dalam saluran Equisidant dengan cerun menurun
Pada carta 4 jam instrumen komoditi Minyak Mentah, terdapat kemunculan Perbezaan antara pergerakan harga #CL dan penunjuk Pengayun Stochastic , yang menunjukkan bahawa dalam masa terdekat terdapat potensi untuk pembetulan
InstaTrade dalam angka
Your IP address shows that you are currently located in the USA. If you are a resident of the United States, you are prohibited from using the services of InstaFintech Group including online trading, online transfers, deposit/withdrawal of funds, etc.
If you think you are seeing this message by mistake and your location is not the US, kindly proceed to the website. Otherwise, you must leave the website in order to comply with government restrictions.
Why does your IP address show your location as the USA?
Please confirm whether you are a US resident or not by clicking the relevant button below. If you choose the wrong option, being a US resident, you will not be able to open an account with InstaTrade anyway.
We are sorry for any inconvenience caused by this message.