Lihat juga

 22.01.2026 05:19 AM
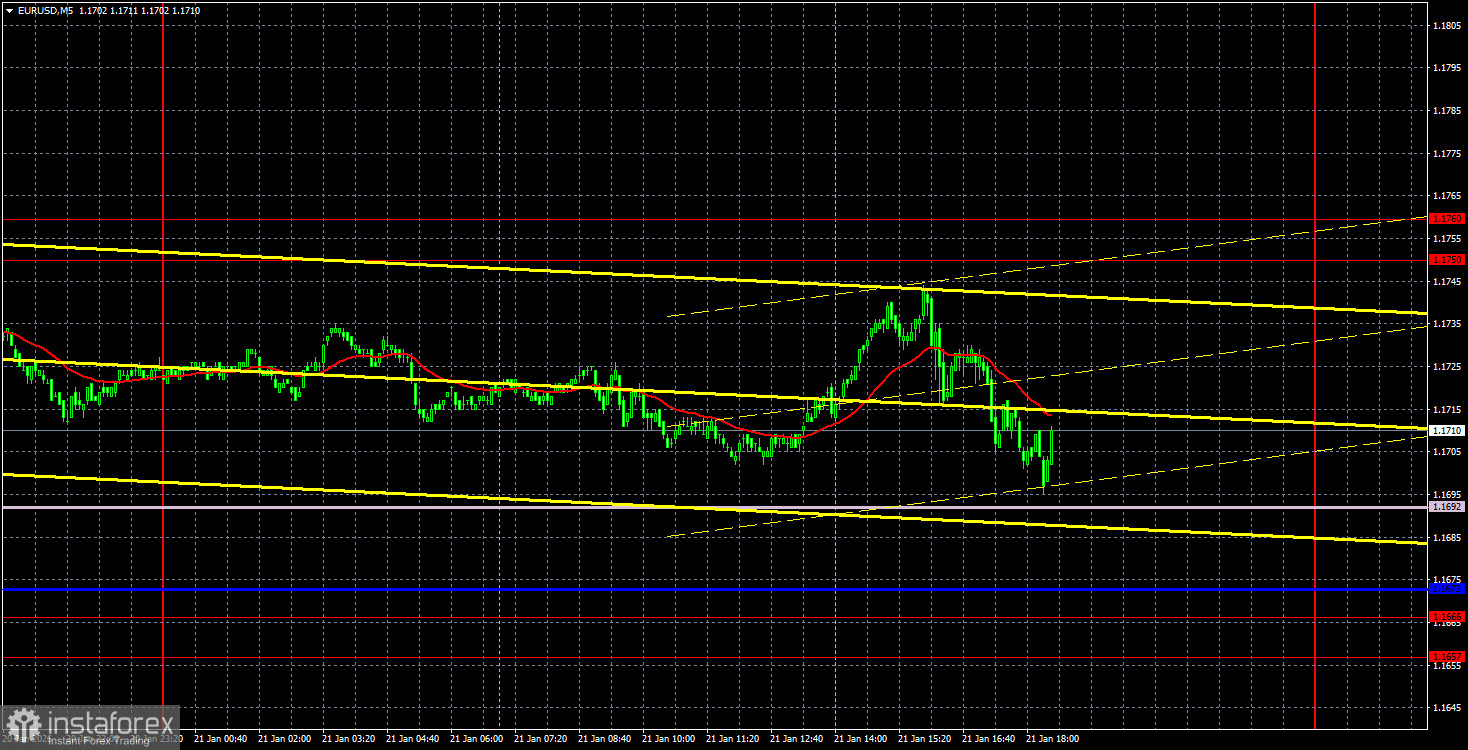
Pada hari Rabu, pasangan mata wang EUR/USD gagal menentukan arah. Perlu diakui bahawa acara hari itu menyumbang kepada kepanikan pasaran. Kita harus bermula dengan ucapan Presiden Donald Trump di Davos. Seperti biasa, Presiden AS itu mula mengkritik Kesatuan Eropah (EU). Menurut Trump, EU sedang menuju ke arah yang salah sepenuhnya. Beliau mengkritik kebebasan pergerakan dalam Kesatuan Eropah, komitmen terhadap tenaga hijau dan kelemahan ekonomi, serta menasihatkan mereka supaya menjadikan AS sebagai contoh. Tidak lama kemudian, dalam sebuah majlis makan malam tertutup, Setiausaha Perdagangan AS, Howard Lutnick, juga mengkritik Kesatuan Eropah; selepas itu, Presiden Bank Pusat Eropah (ECB), Christine Lagarde, meninggalkan majlis makan malam itu lebih awal. Seperti yang dilihat, delegasi Amerika tiba di Davos bukan untuk meredakan ketegangan mengenai isu Greenland. Objektifnya adalah memberi tekanan tambahan kepada Kesatuan Eropah serta menonjolkan kelemahan dan kekurangan mereka. Sukar bagi kami untuk mengatakan berapa lama Eropah akan bertahan dengan layanan demikian.
Tiada acara ekonomi makro yang signifikan pada hari Rabu. Gambaran teknikal pada carta masa sejam kekal tidak berubah. Harga telah menembusi garis aliran menurun dan garis penunjuk Ichimoku; oleh itu, walaupun dalam jangka pendek, kami menjangkakan euro akan terus mengukuh. Pada pandangan kami, pasangan ini dijangka segera kembali ke zon 1.1800–1.1830, di mana nasibnya akan ditentukan semula: sama ada pengukuhan akan berterusan, atau pertumbuhan akan disambung semula.
Pada carta masa 5 minit, tiada isyarat dagangan terbentuk semalam; mungkin itu yang terbaik. Acara hari tersebut sukar diramal, dan pasaran sendiri tidak memahami bagaimana menafsirkannya. Oleh itu, pasangan EUR/USD mengalami ketidaktentuan yang tinggi sepanjang hari. Dalam keadaan sedemikian, membuka apa-apa kedudukan dagangan adalah amat berisiko.
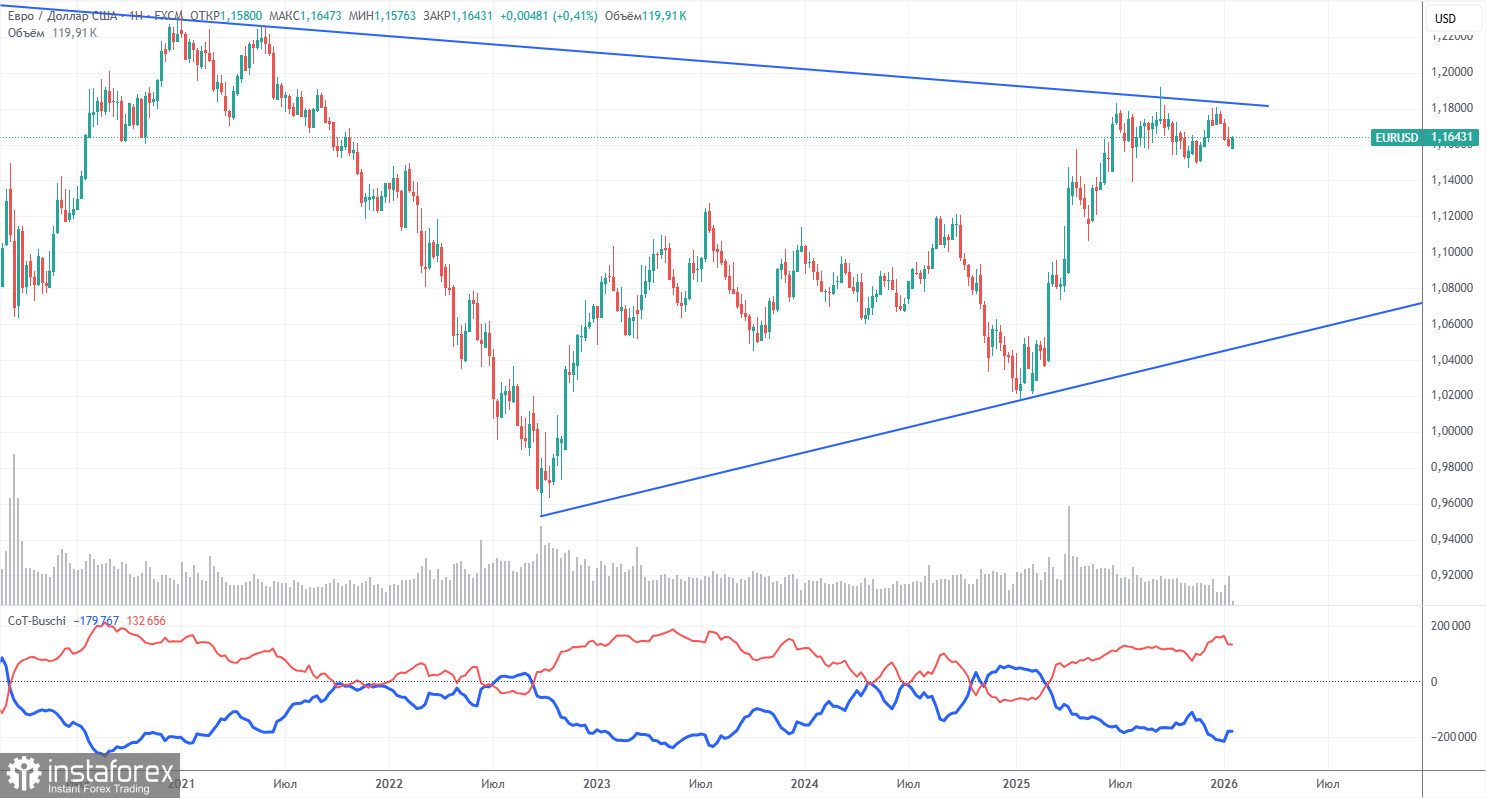
Laporan Komitmen Pedagang (COT) terkini bertarikh 13 Januari. Rajah di atas jelas menunjukkan bahawa kedudukan bersih pedagang bukan komersial kekal condong ke arah kenaikan. Sejak Donald Trump menjawat semula jawatan Presiden AS, hanya dolar yang mencatatkan kejatuhan. Kita tidak boleh menyatakan kejatuhan dolar akan berterusan dengan kebarangkalian 100%, namun perkembangan global semasa mencadangkan bahawa senario tersebut berkemungkinan berlaku. Garis merah dan biru semakin menjauh, menandakan dominasi aliran menaik yang kukuh.
Kami masih tidak menemui faktor asas yang menyokong pengukuhan euro, manakala terdapat banyak faktor yang menyokong kejatuhan dolar AS. Aliran menurun global masih berterusan; tetapi apakah implikasinya kini, memandangkan harga telah bergerak sepanjang 17 tahun yang lalu? Dalam tempoh tiga tahun kebelakangan ini, hanya euro yang menunjukkan kenaikan, dan aliran itu terus berlanjutan.
Kedudukan garisan penunjuk merah dan biru terus mencerminkan pemeliharaan serta pengukuhan aliran menaik. Sepanjang minggu laporan lalu, bilangan kedudukan panjang yang dipegang oleh kumpulan bukan komersial berkurangan sebanyak 14,600, manakala bilangan kedudukan pendek meningkat sebanyak 15,500. Oleh itu, kedudukan bersih bagi minggu ini menurun sebanyak 30,100 kontrak.
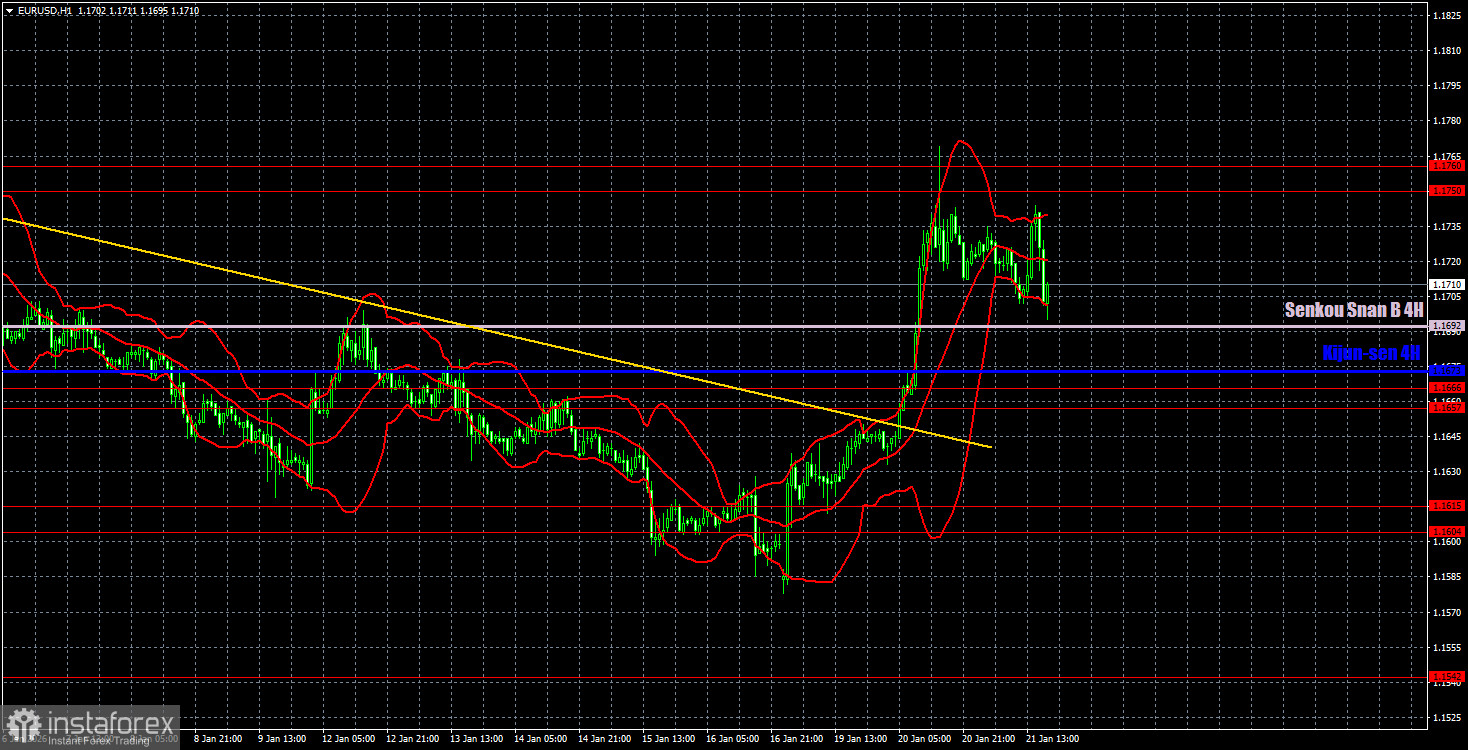
Pada carta masa setiap jam, pasangan EUR/USD telah menembusi aliran menurun. Dalam masa terdekat, euro mungkin kembali ke garis atas saluran mendatar 1.1400–1.1830, yang kami harapkan, dan keluar dari zon terkutuk ini. Latar belakang fundamental dan makroekonomi terus menyokong euro berbanding dolar.
Untuk 22 Januari, kami tekankan paras berikut untuk dagangan: 1.1234, 1.1274, 1.1362, 1.1426, 1.1542, 1.1604–1.1615, 1.1657–1.1666, 1.1750–1.1760, 1.1846–1.1857, 1.1922, 1.1971–1.1988, serta garis Ichimoku Senkou Span B (1.1692) dan Kijun-sen (1.1673). Garis Ichimoku mungkin berubah sepanjang hari, yang harus diambil kira ketika menentukan isyarat perdagangan. Jangan lupa untuk menggerakkan Henti Rugi (SL) ke titik pulangan modal jika harga telah bergerak 15 pip ke arah yang betul. Ini akan melindungi daripada kerugian yang mungkin berlaku jika isyarat adalah palsu.
Tiada acara penting yang dijadualkan di Zon Euro pada hari Khamis, manakala AS akan menerbitkan anggaran KDNK ketiga untuk Q3 dan beberapa laporan sampingan. Pada pandangan kami, pasaran akan terus memantau dengan teliti acara geopolitik dan perselisihan EU-AS. Tidak kira sekuat mana pertumbuhan ekonomi AS, pedagang tidak mempercayai angka itu, dan ia tidak akan membantu dolar.
Pada hari Khamis, pedagang boleh berdagang dari kawasan 1.1750–1.1760 atau dari garis Senkou Span B. Lonjakan daripada kawasan ini akan membolehkan membuka kedudukan jual dengan sasaran pada 1.1692. Lonjakan dari garis Senkou Span B akan menjadikan kedudukan beli relevan dengan sasaran pada 1.1750–1.1760.


