Lihat juga

 07.05.2026 04:23 AM
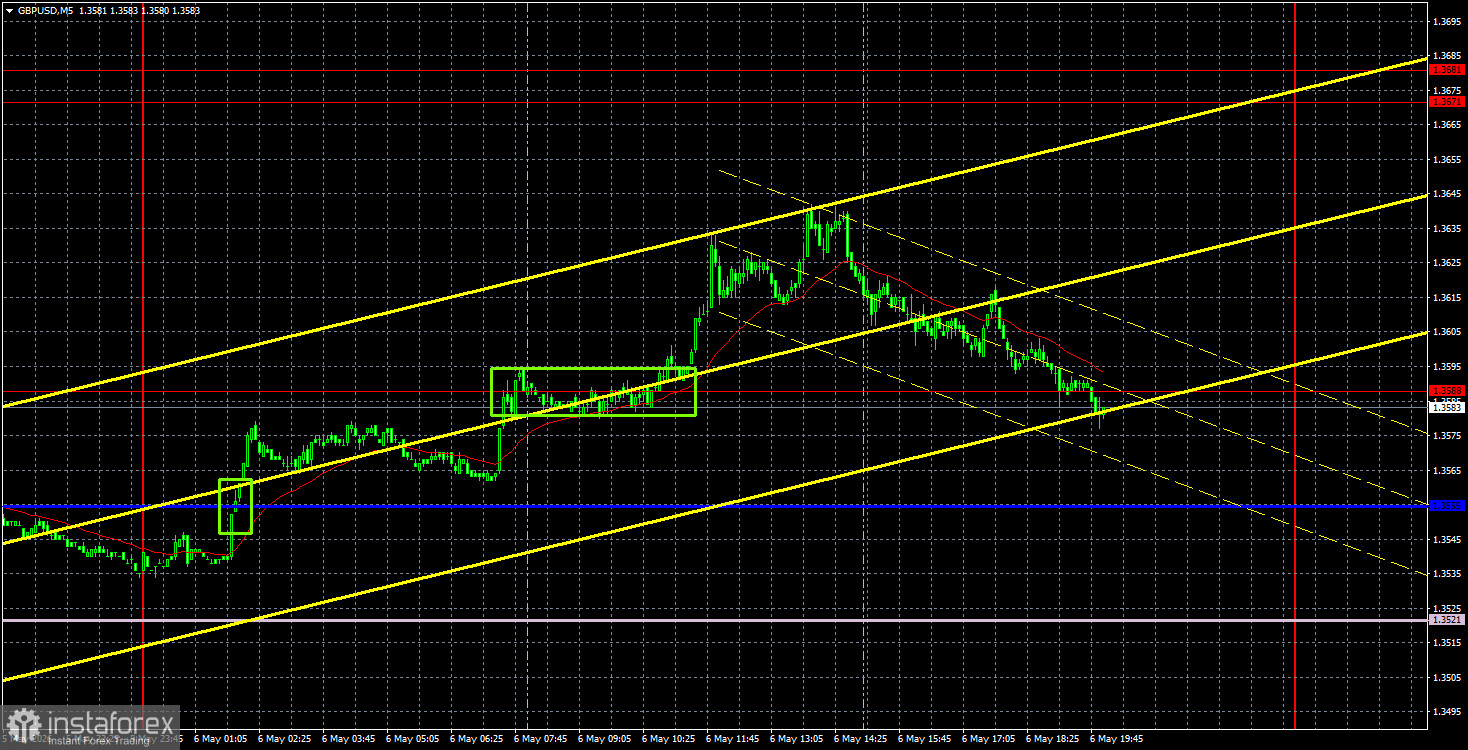
The GBP/USD currency pair surged again on Wednesday, similar to the EUR/USD pair, but market exuberance was tempered in the afternoon. Dollar sales began after a series of messages from Iran and the US, which once again indicated the possibility of peace and an agreement between the two "troublemakers." However, as the evening approached, the market suddenly remembered that trusting Donald Trump at his word is akin to walking on ice at freezing temperatures and hoping not to fall through. Furthermore, no news from Tehran indicated any closeness to a deal or ceasefire. Iranian Foreign Minister Abbas Araqchi merely stated that Iran is ready for a deal, but on fair terms. This phrasing suggests that US conditions are unacceptable. Whether Trump is willing not only to demand but also to make concessions remains uncertain. However, the attack on US ships on Monday went unanswered, indicating that Washington seeks an end to the war, not out of a fervent desire to establish peace and resume traffic in the Strait of Hormuz, but because elections are approaching, and Trump's party may lose Congress and the Senate.
On the hourly timeframe, the pair maintains a semblance of an upward trend, but the price is again "dancing" in different directions under the pressure of a constantly changing geopolitical backdrop. The fact that the price remains above the Ichimoku indicator lines confirms the short-term positive outlook for the British pound. In the long term, we do not expect anything other than growth for the pair.
On the 5-minute timeframe, two buy signals were generated on Wednesday. Initially, the pair crossed the critical Kijun-sen line and then surpassed the 1.3588 level. Traders could have acted on either of these signals, but the target area of 1.3671-1.3681 was not reached, so profit could only be realized through manual closure of positions.
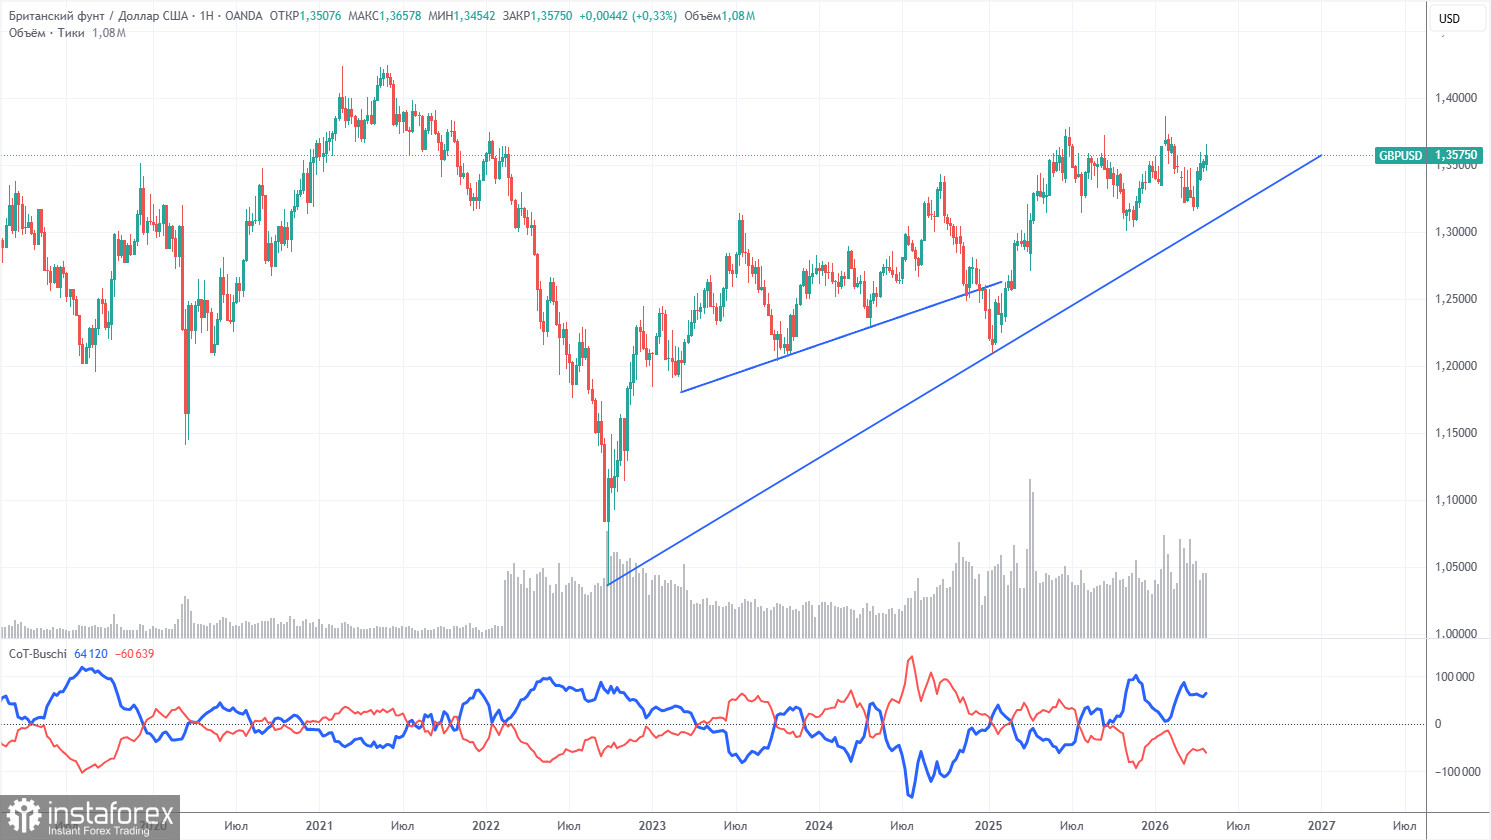
The COT reports for the British pound show that commercial traders' sentiment has fluctuated over recent years. The red and blue lines representing the net positions of commercial and non-commercial traders continuously intersect and are mostly positioned near the zero mark. Currently, the lines are separating, with non-commercial traders still dominating with short positions. Given the events in the Middle East, it is no surprise that demand for risk currencies is falling while demand for the US dollar is rising.
In the long term, the dollar continues to decline due to Trump's policies, as shown on the weekly timeframe (illustration above). The trade war will continue, in one form or another, for a long time, and Trump's policies are aimed directly and indirectly at weakening the US currency. However, geopolitical factors now take precedence, having recently bolstered the dollar. Since the conflict in the Middle East cannot be considered resolved, the US dollar may still show gains in the future. According to the latest COT report (dated April 28), the "Non-commercial" group closed 3,500 BUY contracts and opened 5,000 SELL contracts. Thus, the net position of non-commercial traders decreased by 8,500 contracts over the week.
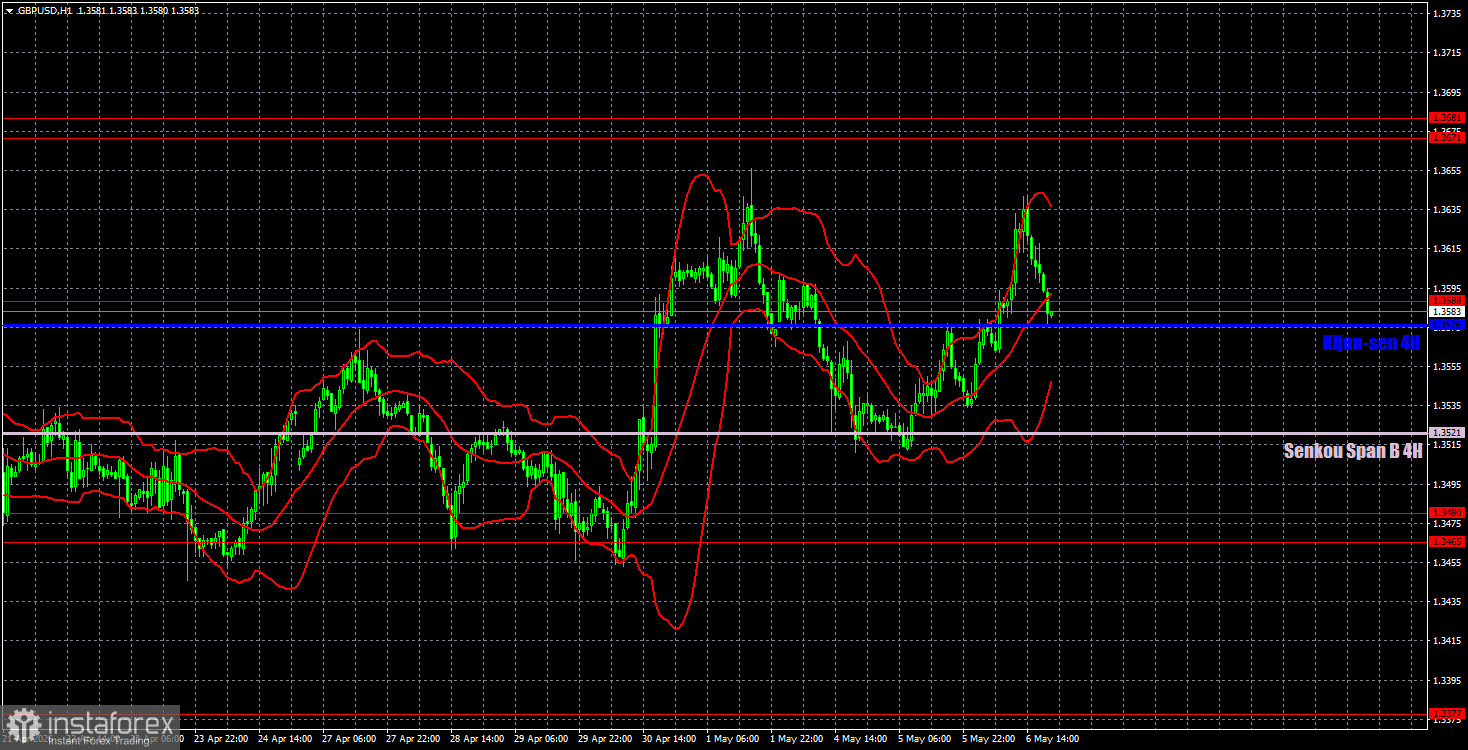
On the hourly timeframe, the GBP/USD pair is continuing to form an upward trend, which could be invalidated if the British pound settles below the 1.3465-1.3480 area or the Ichimoku indicator lines. The influence of geopolitics continues to wane, and the market no longer pays close attention to all news from the Middle East. The dollar has lost its only significant support factor.
For May 7, we highlight the following important levels: 1.3096-1.3115, 1.3179-1.3187, 1.3369-1.3377, 1.3465-1.3480, 1.3588, 1.3671-1.3681, 1.3751-1.3763. The Senkou Span B lines (1.3521) and Kijun-sen (1.3576) may also be sources of signals. A Stop Loss order is recommended to be set to breakeven when the price moves in the correct direction by 20 pips. The Ichimoku indicator lines may move throughout the day, which should be taken into account when determining trading signals.
On Thursday, no major events are scheduled in the UK or the US, but throughout the day, we are likely to see a new batch of news on negotiations between Iran and the US. As long as there is no escalation in the Middle East, the dollar has no reason to expect gains.
Today, traders may consider long positions on a rebound from the 1.3576-1.3588 area, targeting 1.3671-1.3681. Short positions are advised if the price consolidates below the critical line, targeting the Senkou Span B line.


