Lihat juga

 23.06.2026 07:00 AM
Bitcoin has recovered about $8,000 after falling to $22,000. Currently, there are no signs of an end to the upward correction, nor of a conclusion to the downward trend that began last year. On the 4-hour timeframe, an upward structure is maintained, while the daily shows a downward trend. Thus, the situation is clear. On the daily timeframe, there is a clear target for correction—the bearish FVG. Traders should expect a reaction from this FVG and a resumption of the downward trend. The correction may take quite a long time, as we have seen recently, with the cryptocurrency correcting for three months. It is also worth noting the liquidity withdrawal on the daily (or weekly) timeframe from the low of February 6; however, remember that the withdrawal of corrections is a manipulation by market makers and typically has specific characteristics. When large capital gains have access to sufficient liquidity, aggressive trading begins, which we are not currently witnessing. Demand for "digital gold" remains low, miners are increasingly shifting to the AI sector, the Federal Reserve is poised to tighten monetary policy in 2026, and the military conflict in the Middle East cannot be considered fully resolved. Therefore, we do not currently see fundamental and technical grounds for a bullish trend.
On Monday, Bitcoin came under pressure from the market again. News from the Middle East, combined with news from Switzerland, was not entirely clear, so each analyst interpreted it in their own way. Since Bitcoin showed a slight decline, experts immediately concluded that there was weak progress in the negotiations, a new blockage of the Strait of Hormuz, and focused on Trump's new threats to Iran. However, we believe that the geopolitical situation in the Middle East is, first, much better than it was a month ago, and, second, that it remains unknown whether the Strait of Hormuz will be closed again. Bitcoin's movements remain fairly weak and corrective. For such movements, specific reasons are not required.
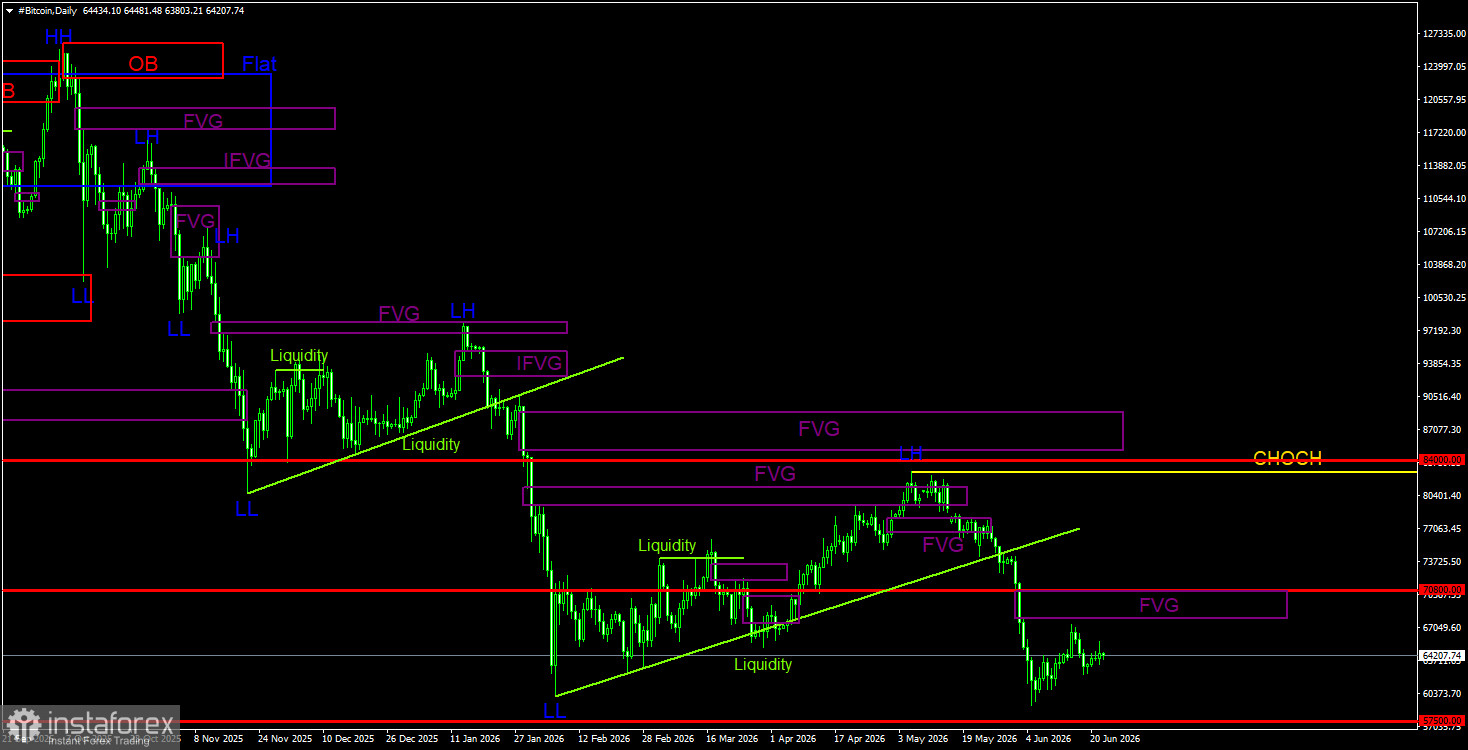
On the daily timeframe, Bitcoin continues to form a downward trend. The trend structure is identified as downward, and the CHOCH line has been moved to $82,800, with a new LL (Lower Low) formed. Only above this level can it be considered that the downward trend has ended. As there are still no signs of an upward trend reversal, we believe the decline will continue. A new bearish FVG has formed within the $68,000 - $70,700 range. Within this pattern, new sell signals may form. However, at the moment, the pattern has not yet been realized.
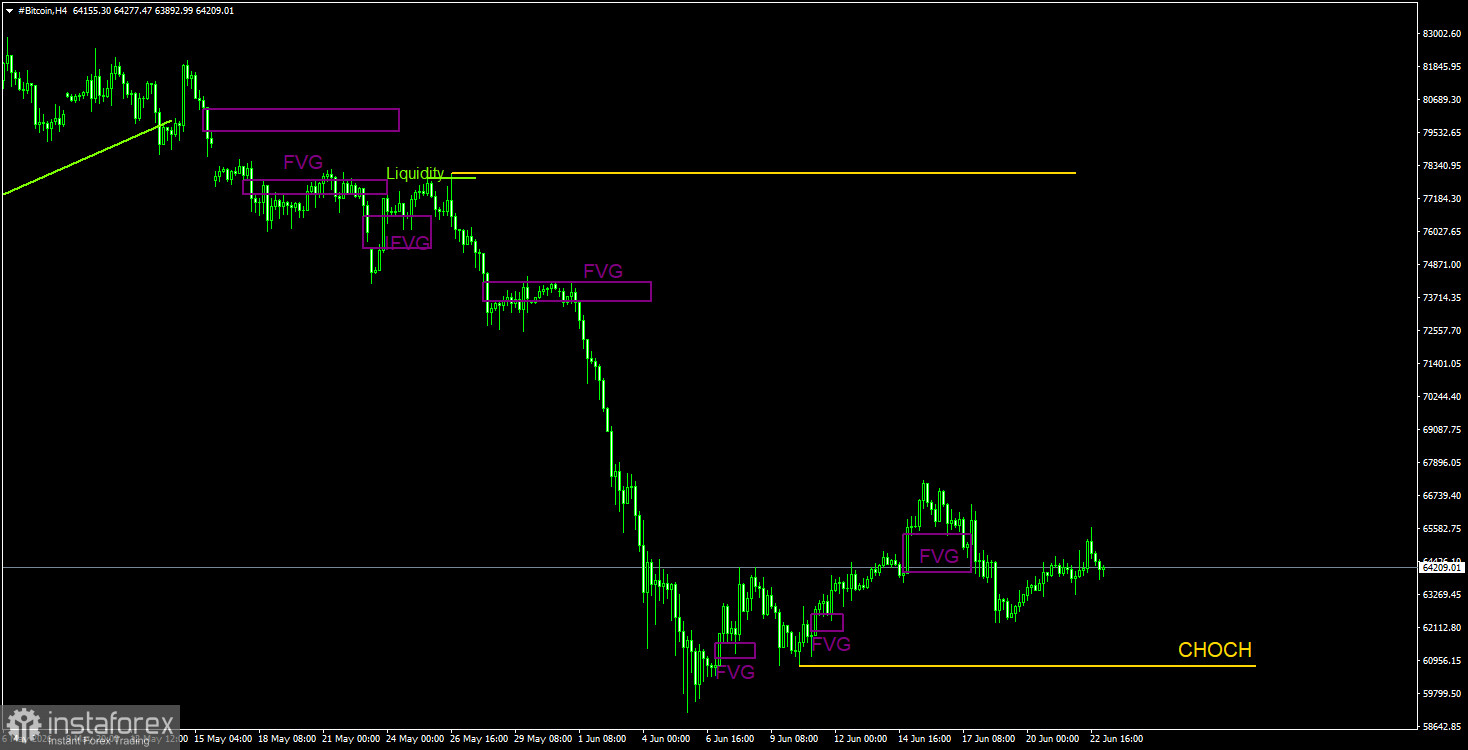
On the 4-hour timeframe, Bitcoin continues its upward correction. The CHOCH line supporting the correction lies at $60,765. Bearish patterns can be used to open new short positions, but it's best to use the daily timeframe for this purpose. As for buy positions, they may be possible from bullish patterns on the 4-hour timeframe, but one should understand that expecting strong growth during a downward trend is not advisable. The last bullish FVG in the $64,100 - $65,370 range did not produce any reaction, and there has been no structural break on the M30 (as confirmation). A structural breakdown (overcoming the CHOCH line) will indicate a possible resumption of the main trend. No new bullish patterns have been formed in recent days.
Bitcoin continues to form a full-fledged downward trend and a correction against it. We continue to expect a decline with a target of $57,500 (the 61.8% Fibonacci level from the three-year upward trend), and there are still no signs of an upward trend emerging. The last bearish pattern FVG was formed in the range of $68,000 - $70,700, making this area a point of interest for short positions in the coming weeks. On the 4-hour timeframe, the cryptocurrency may be in an upward correction for the near future, so if traders wish to trade against the trend, they may consider small longs from bullish patterns. But the correction can end at any moment.
CHOCH – break in trend structure.
Liquidity – liquidity, Stop Loss, and pending orders that market makers use to build their positions.
FVG – Area of price inefficiency. Price moves through these areas very quickly, indicating a complete absence of one side in the market. Subsequently, price tends to return and react to such areas in continuation of the main trend.
IFVG – Inverted area of price inefficiency. After returning to such an area, the price does not respond but impulsively breaks through and then tests from the other side.
OB – Order Block. The candle on which the market maker opened a position aimed at gathering liquidity to form their own position in the opposite direction.


