
Lihat juga


 14.08.2026 07:17 AM
Bitcoin and Ether continue to correct, and the correction may take quite a long time. Over the past one and a half months, Ether and Bitcoin have recovered slightly, but there is still no sign of the end of the downtrend that began last year. The fundamental backdrop remains weak for the crypto segment and is mainly reflected in low spot demand, the flow of capital into the artificial intelligence sector, and the Federal Reserve's commitment to achieving 2% inflation, which implies, at minimum, the maintenance of tight monetary policy in the near term. Thus, we still do not see grounds for a prolonged rise in Bitcoin and Ether.
Meanwhile, independent experts are increasingly discussing a new status for Bitcoin in the global financial system. Recall that Bitcoin was for a long time linked to US stock indexes (both assets are risky) or to gold (a safe asset). According to most "experts" in recent years, Bitcoin was supposed to rise at any given moment. If gold rises, Bitcoin should rise too, because Bitcoin is "digital gold," a "hedge against inflation," and a "safe haven." If the US stock market rises, Bitcoin should rise as well, because Bitcoin is a risky asset. Most of these "experts" have still failed to decide what Bitcoin actually is: a risky asset or a "safe haven"? And this fact explains better than anything to traders whether they should listen to statements by Michael Saylor, Cathie Wood, or Robert Kiyosaki. All these businessmen are respected figures in the financial world, but they are parties interested in Bitcoin's growth. Because they themselves have investments in "digital gold" or manage companies engaged in investments. Naturally, they will forecast eternal growth of the first cryptocurrency, because growth requires an inflow of capital and new investors. If neither the first nor the second exists, how will the asset grow?
By the way, the US stock market does not need advertising and constant growth forecasts. US stock indexes continue to rise regardless. Yes, many experts note another "bubble" that can burst at any moment. But it has not burst yet. As for Bitcoin, the asset's price has been falling for three quarters already.
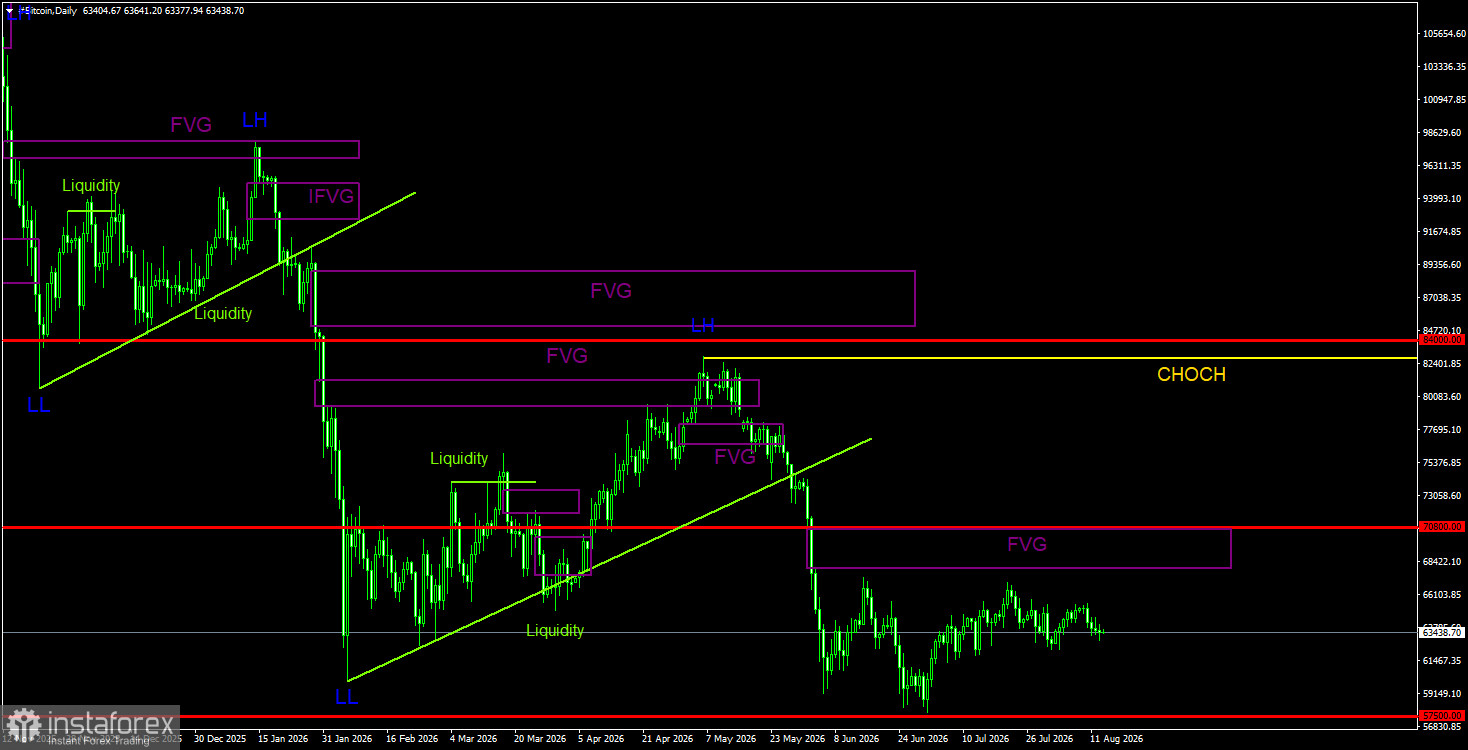
Bitcoin continues to form a full-fledged downtrend. We continue to expect a decline targeting $57,500 (the 61.8% Fibonacci level of the three-year uptrend), although this level has, in essence, already been worked through. But we do not believe the downtrend is over. The last "bearish" FVG pattern was formed in the $68,000–$70,700 area on the daily TF, so this area acts as a POI for short positions over the coming weeks. On the 4-hour TF, Bitcoin is again inclined to fall, but most likely movements will remain choppy and "swingy." Traders can consider trade options from local patterns, but we would not expect strong moves now.
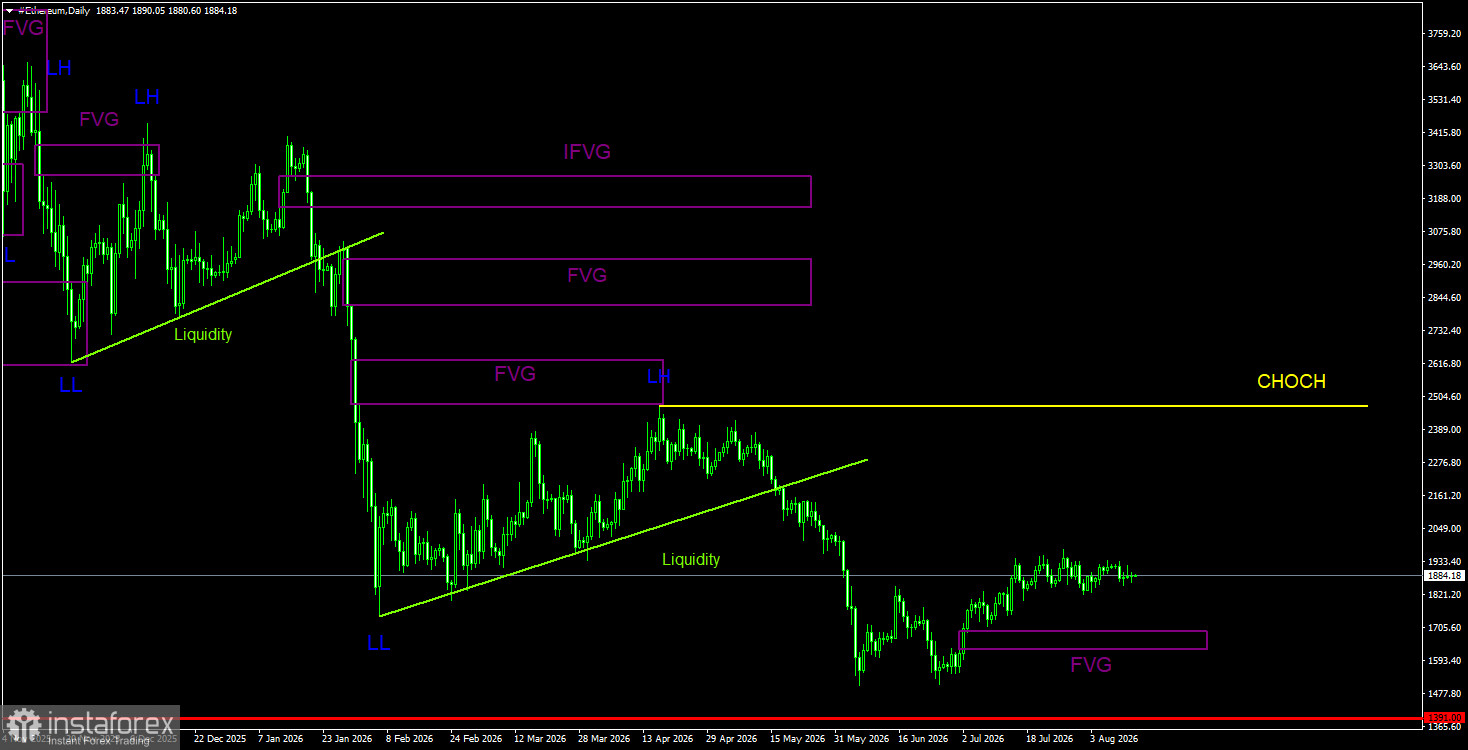
On the daily TF, the downtrend that began in August last year continues to form. The key sell pattern remains the "bearish" order block on the weekly TF. We do not believe the current downtrend is over, since there are no signs of its completion for either Bitcoin or Ether. A second wave of correction is currently underway, which recently transformed into a flat. In a flat, you can only trade from its boundaries, and the further direction will be determined after the flat ends. Near the upper boundary of the sideways channel, $1,800–$1,942, no deviation or pattern was formed, so no trading signal appeared. At present, Ether is located exactly in the middle of the channel.
CHOCH – break of trend structure.
Liquidity – liquidity, stop-loss, pending orders that market makers use to accumulate their positions.
FVG – area of price inefficiency. Price moves very quickly through such areas, indicating the complete absence of one side in the market. Subsequently, price tends to return and receive a reaction from such areas in continuation of the main trend.
IFVG – inverted area of price inefficiency. After returning to such an area, the price does not receive a reaction there but impulsively breaks through and then tests from the other side.
OB – Order block. A candle on which a market maker opened a position to take liquidity to form their own position in the opposite direction.


