
Lihat juga


 15.10.2026 04:40 AM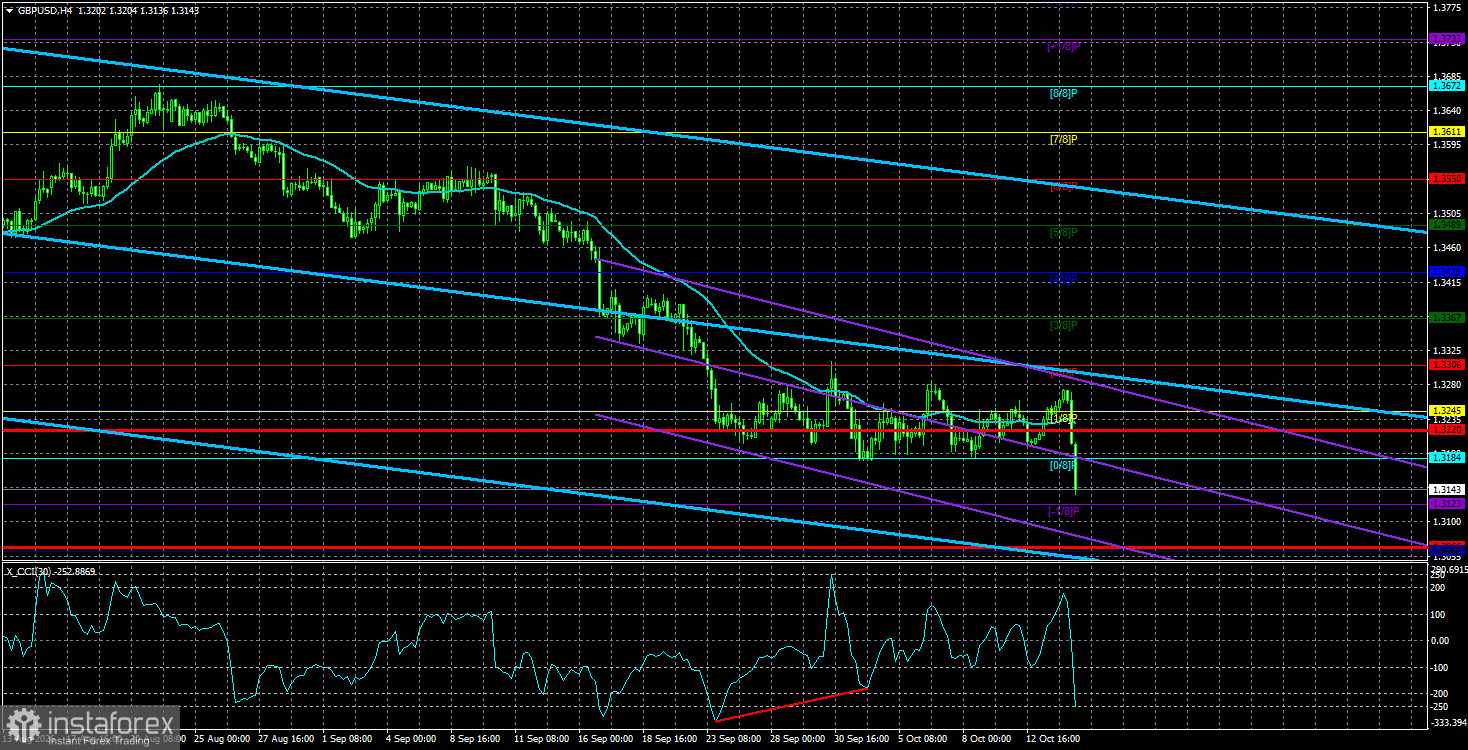
The GBP/USD currency pair tried to extend its rise on the third trading day of the week but ultimately collapsed. The pound traded within a local sideways channel for 2.5 weeks, but after the US inflation report, traders resumed selling, triggering a new drop. Sideways channels remain visible on the daily and weekly timeframes.
We have repeatedly drawn traders' attention to the fact that the market is behaving as if the Federal Reserve raises the policy rate at every meeting, while in the UK everything is fine — inflation is not rising, and energy prices are low. UK inflation is indeed weaker than US inflation, but Andrew Bailey himself has warned several times that it could accelerate to 4% by year-end. That means the Bank of England expects inflation to pick up, yet it is not rushing to raise rates.
But what difference does it make when UK inflation exceeds the central bank's target and when the central bank actually tightens policy? If Andrew Bailey says inflation is likely to accelerate to 4%, then a rise to that level is quite probable. The remaining question is how the BoE will act. The answer seems obvious: raise the policy rate. The question is: how many times?
We have recently said the BoE will raise rates 2–3 times. Fewer than two hikes makes little sense, as such small changes would have minimal impact on inflation. So far, there is no basis for more than three tightenings—inflation has not jumped to double digits, and no one knows how the Middle East conflict will evolve after the US Congressional elections. Thus, two to three hikes — which the market has certainly not already priced in fully — seem reasonable.
Yesterday, the BoE's chief economist, Huw Pill, indirectly confirmed our expectations. Pill said the BoE will have to intervene in inflationary processes because the risk of entrenched inflation is rising. At the same time, he cast doubt on market expectations of four rounds of tightening over the next 12 months. According to Pill, the need for BoE intervention is becoming clearer, but the market likely expects too much from the UK central bank.
So Pill effectively signaled that the market can expect around two to three rate increases. Many traders may have been disappointed and started selling the dollar again, but the market has not fully priced in any of the BoE's tightening rounds yet. We therefore remind readers that the pound sits at the bottom of three sideways channels, while the US dollar in 2026 has already priced in available bullish drivers with a large margin.
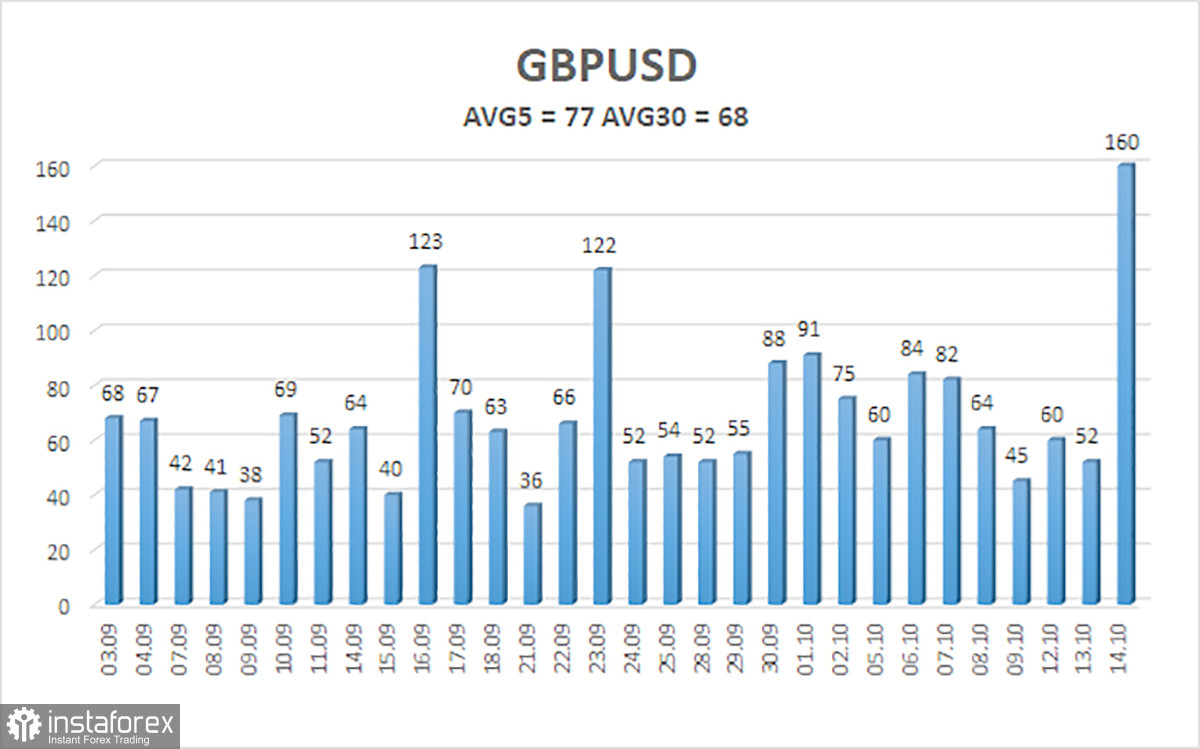
The average volatility of the GBP/USD pair over the last 5 trading days is 77 pips. For the pound/dollar pair, this value is characterized as "average." On Thursday, October 15, we therefore expect movement inside a range bounded by 1.3066 and 1.3220. The higher linear-regression channel is turning down again. The CCI indicator entered the oversold area twice and also formed a "bullish" divergence, which warns of a possible end to the downtrend.
S1 – 1.3123
S2 – 1.3062
R1 – 1.3184
R2 – 1.3245
R3 – 1.3306
The GBP/USD currency pair continues its illogical downward move. Donald Trump's policies will continue to exert pressure on the US economy, so we do not expect long-term appreciation of the US dollar. The year 2026 so far has been favorable for the dollar due to geopolitics and inflation, which forced capital to seek safety and prompted the Fed to return to monetary tightening. However, on the weekly timeframe, a flat range between 1.3150 and 1.3780 persists within a four-year uptrend, supporting expectations for medium-term pound strengthening. Consider long positions with targets of 1.3367 and 1.3428 if price is above the moving average. If price is below the moving average, consider bearish trades with targets of 1.3123 and 1.3062. Be cautious with short positions, as price is at the lower boundary of the long-term sideways channel!


