Bullish Rectangle
was formed on 30.05 at 06:13:12 (UTC+0)
signal strength 1 of 5
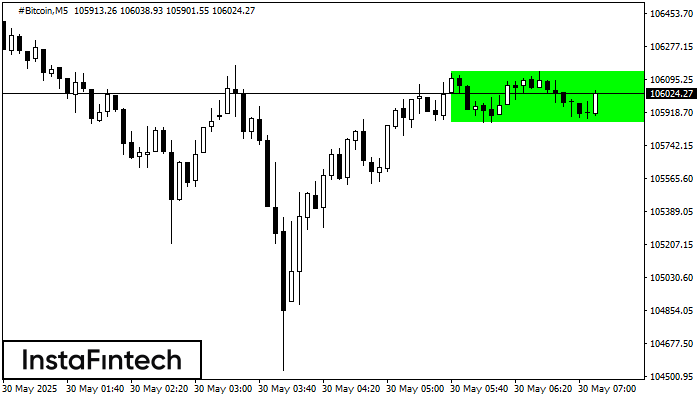
According to the chart of M5, #Bitcoin formed the Bullish Rectangle. The pattern indicates a trend continuation. The upper border is 106138.63, the lower border is 105867.53. The signal means that a long position should be opened above the upper border 106138.63 of the Bullish Rectangle.
The M5 and M15 time frames may have more false entry points.
Juga lihat
- All
- All
- Bearish Rectangle
- Bearish Symmetrical Triangle
- Bullish Rectangle
- Double Top
- Double Top
- Triple Bottom
- Triple Bottom
- Triple Top
- Triple Top
- All
- All
- Buy
- Sale
- All
- 1
- 2
- 3
- 4
- 5
Triple Bottom
was formed on 29.07 at 03:30:10 (UTC+0)
signal strength 2 of 5
Corak Triple Bottom telah dibentuk pada AUDUSD M15. Ia mempunyai ciri-ciri berikut: tahap rintangan 0.6537/0.6526; tahap sokongan 0.6517/0.6511; lebar corak adalah 20 mata. Dalam situasi penembusan paras rintangan 0.6537, harga
Carta masa M5 dan M15 mungkin mempunyai lebih banyak titik kemasukan palsu.
Open chart in a new window
Inverse Head dan Shoulder
was formed on 29.07 at 00:00:10 (UTC+0)
signal strength 2 of 5
According to M15, AUDCAD is shaping the technical pattern – the Inverse Head dan Shoulder. In case the Neckline 0.8960/0.8956 is broken out, the instrument is likely to move toward
Carta masa M5 dan M15 mungkin mempunyai lebih banyak titik kemasukan palsu.
Open chart in a new window
Flag Aliran Menaik
was formed on 28.07 at 23:43:16 (UTC+0)
signal strength 3 of 5
Corak Flag Aliran Menaik telah dibentuk pada AUDCHF at M30. Sempadan bawah bagi corak adalah terletak pada 0.5236/0.5230, manakala sempadan yang lebih tinggi terletak pada 0.5242/0.5236. Unjuran flagpole adalah
Open chart in a new window