یہ بھی دیکھیں


 19.02.2025 08:16 AM
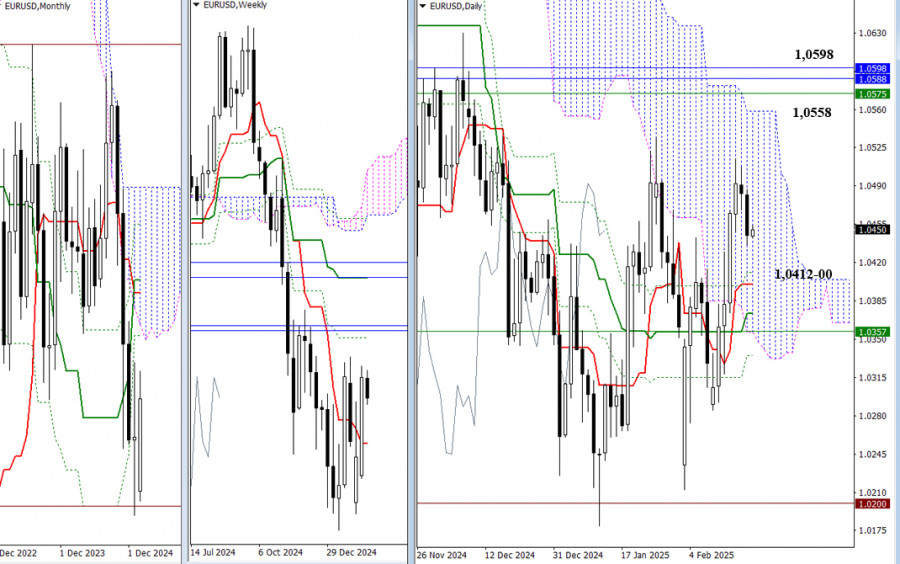
At the start of the new trading week, bearish players have paused, leading to a daily corrective decline. The daily Ichimoku cross serves as the nearest reference point for this downward correction, with its levels positioned at the boundaries of 1.0411, 1.0400, 1.0373, and 1.0335 today. Additionally, key supports reinforce the daily cross in this area, including the lower boundary of the daily cloud at 1.0356 and the weekly short-term trend at 1.0357.
If players can halt the correction and resume the upward movement by breaking the recent high of 1.0515, then the movement will be directed towards upward reference points between 1.0558 and 1.0598. These targets align with the upper boundary of the daily cloud, the weekly Fibonacci Kijun, and monthly levels.
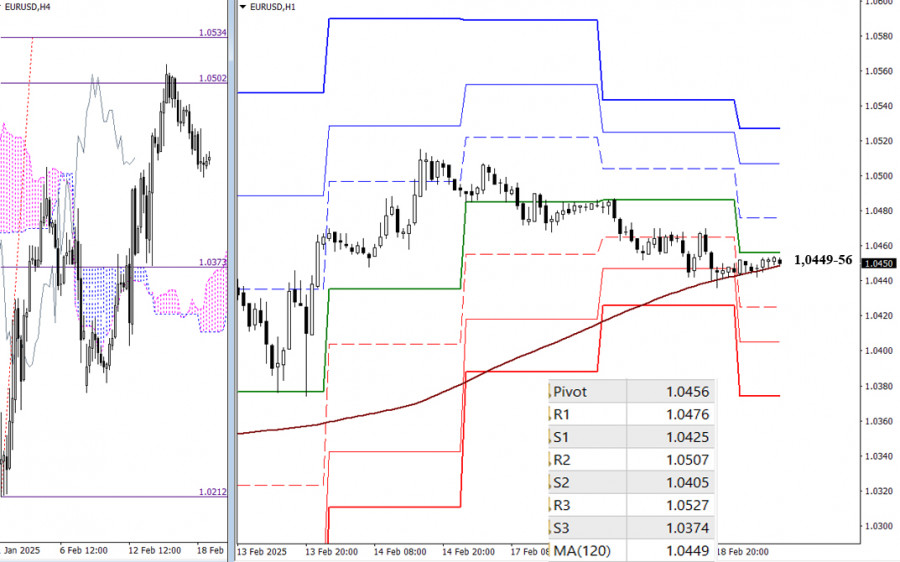
On lower timeframes, bulls have only managed to achieve the first target for the H4 cloud breakout at 1.0502. They may be able to complete the corrective decline and achieve the H4 target of 1.0534. Additional intraday targets that may factor into this move include the resistance of the classic Pivot levels at 1.0476, 1.0507, and 1.0527.
Currently, EUR/USD is testing critical support levels at 1.0449 (weekly long-term trend) and 1.0456 (daily central Pivot level). A breakout below these levels could shift the market balance and strengthen bearish sentiment. The classic Pivot levels S1 (1.0425), S2 (1.0405), and S3 (1.0374) will serve as support on lower timeframes.
***
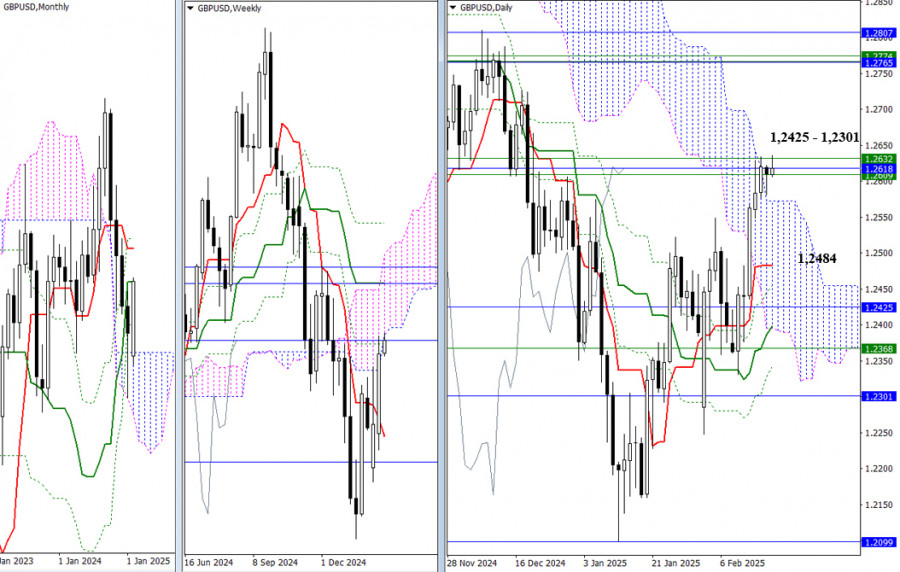
The GBP/USD pair is currently testing resistance levels on both a weekly and monthly basis, ranging from 1.2609 to 1.2618 and 1.2632. Meanwhile, bullish traders are trying to consolidate above the daily cloud at 1.2572, which could set the stage for upward momentum.
If buyers fail and a reversal occurs, the market will likely return to the daily cloud and head toward support levels. The first key support on this path is the daily short-term trend at 1.2484. After that, the market will encounter additional reinforced supports from the daily cross, along with monthly levels at 1.2425 and 1.2301, and a weekly level at 1.2368.
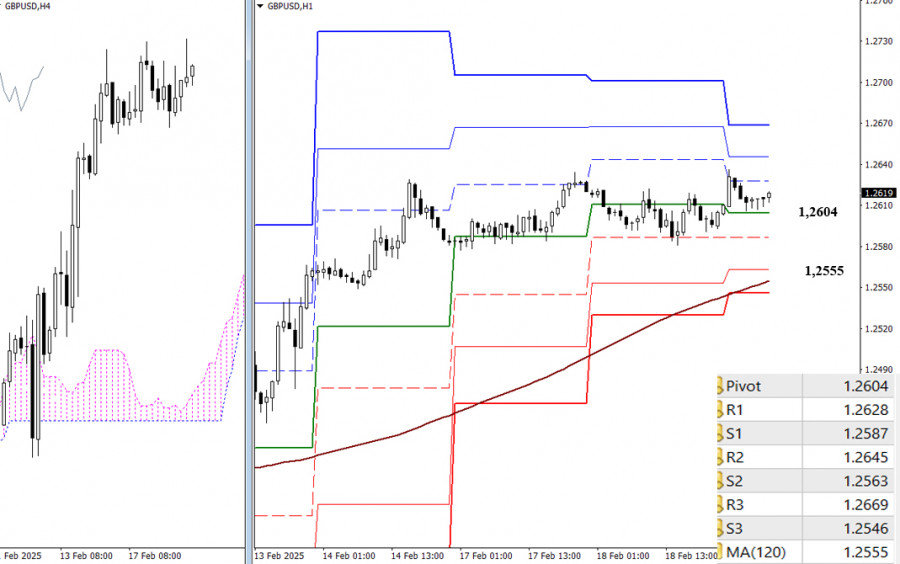
In recent days, GBP/USD has mainly shown sideways movement, indicating market uncertainty. The upside targets are the classic Pivot resistance levels at 1.2628, 1.2645, and 1.2669.
If the price starts to decline, the key downside target will be the weekly long-term trend at 1.2555. A breakout could shift the market balance. A confirmed breakdown beneath this level would strengthen bearish sentiment and give sellers a market advantage. Additionally, important intraday support levels include the classic Pivot levels at 1.2587, 1.2563, and 1.2546.
***
You have already liked this post today
*تعینات کیا مراد ہے مارکیٹ کے تجزیات یہاں ارسال کیے جاتے ہیں جس کا مقصد آپ کی بیداری بڑھانا ہے، لیکن تجارت کرنے کے لئے ہدایات دینا نہیں.


