empty
19.02.2025 08:16 AM
EUR/USD and GBP/USD – February 19 Technical Analysis

EUR/USD

This image is no longer relevant

Higher Timeframes

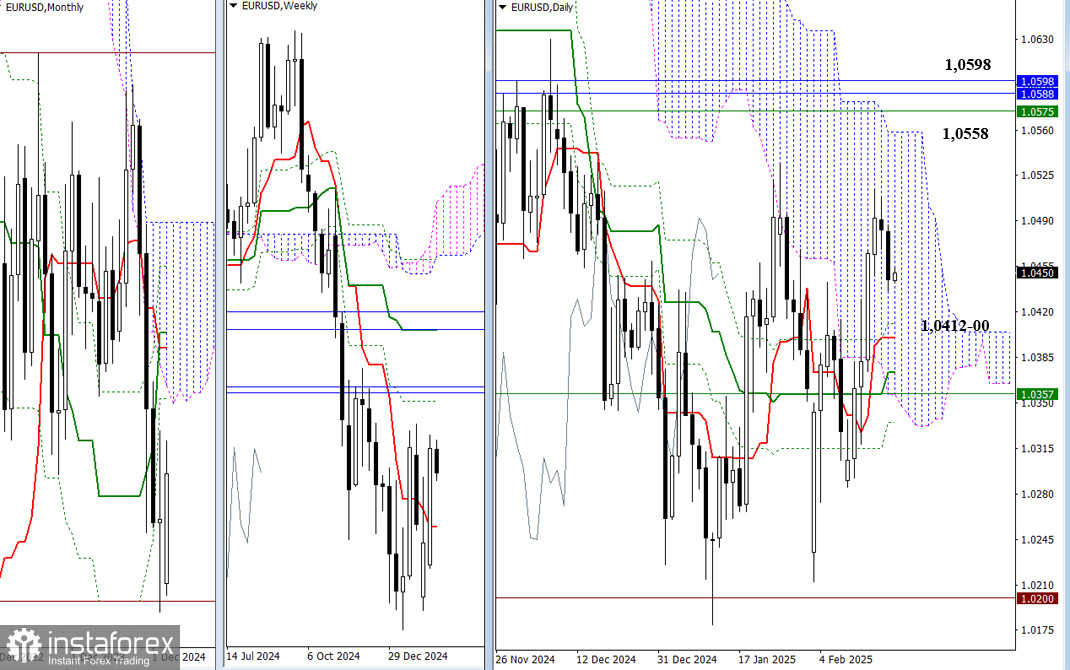
At the start of the new trading week, bearish players have paused, leading to a daily corrective decline. The daily Ichimoku cross serves as the nearest reference point for this downward correction, with its levels positioned at the boundaries of 1.0411, 1.0400, 1.0373, and 1.0335 today. Additionally, key supports reinforce the daily cross in this area, including the lower boundary of the daily cloud at 1.0356 and the weekly short-term trend at 1.0357.

If players can halt the correction and resume the upward movement by breaking the recent high of 1.0515, then the movement will be directed towards upward reference points between 1.0558 and 1.0598. These targets align with the upper boundary of the daily cloud, the weekly Fibonacci Kijun, and monthly levels.

This image is no longer relevant

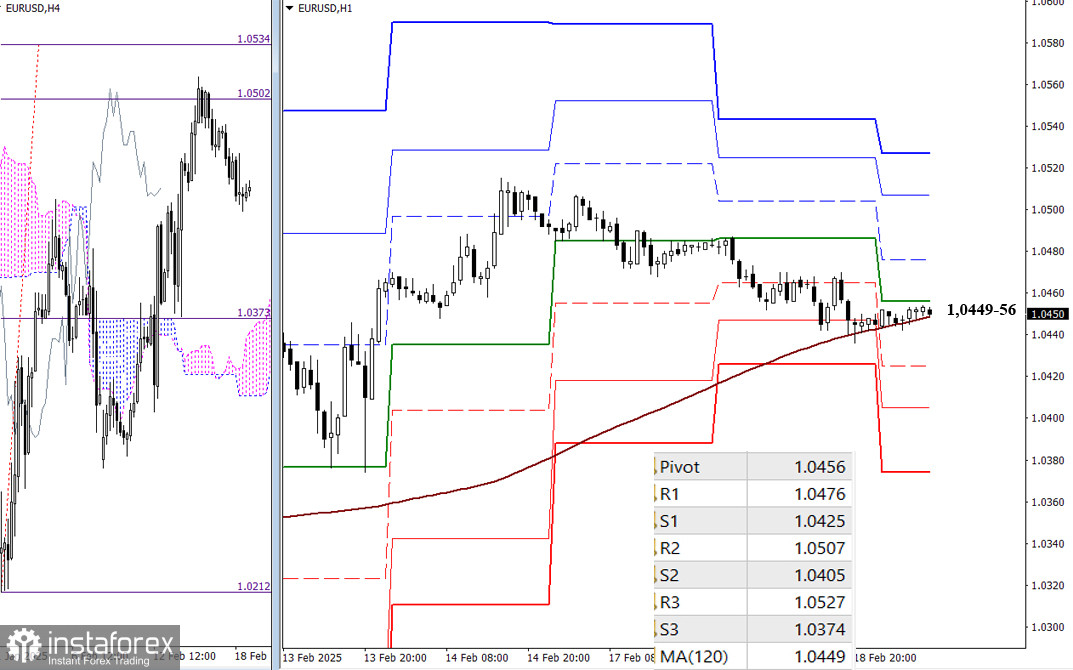
On lower timeframes, bulls have only managed to achieve the first target for the H4 cloud breakout at 1.0502. They may be able to complete the corrective decline and achieve the H4 target of 1.0534. Additional intraday targets that may factor into this move include the resistance of the classic Pivot levels at 1.0476, 1.0507, and 1.0527.

Currently, EUR/USD is testing critical support levels at 1.0449 (weekly long-term trend) and 1.0456 (daily central Pivot level). A breakout below these levels could shift the market balance and strengthen bearish sentiment. The classic Pivot levels S1 (1.0425), S2 (1.0405), and S3 (1.0374) will serve as support on lower timeframes.

***

GBP/USD

This image is no longer relevant

Higher Timeframes

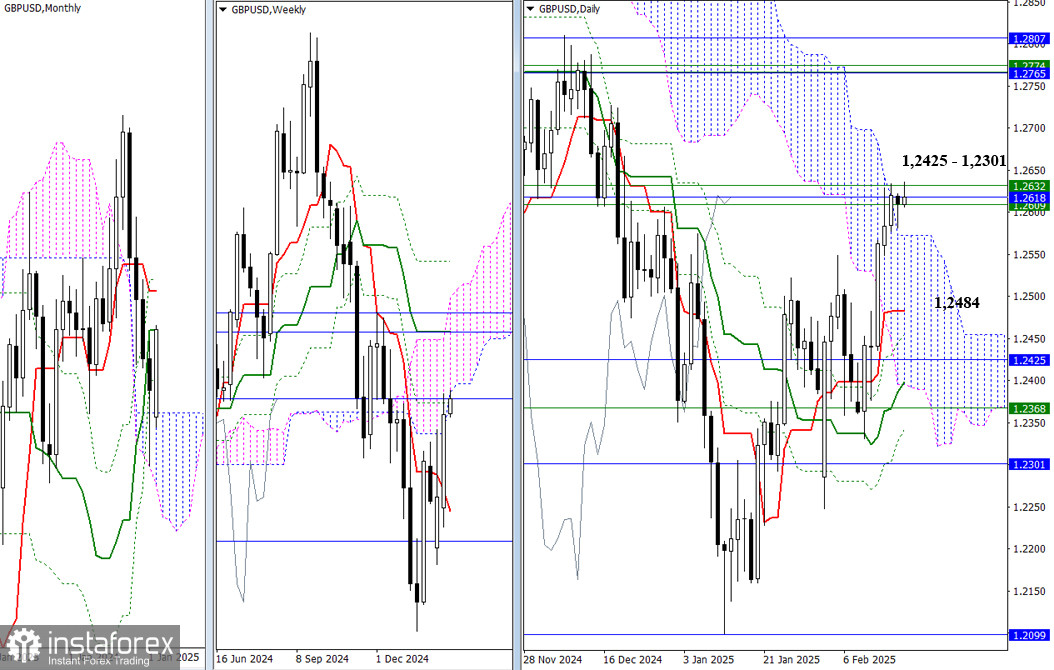
The GBP/USD pair is currently testing resistance levels on both a weekly and monthly basis, ranging from 1.2609 to 1.2618 and 1.2632. Meanwhile, bullish traders are trying to consolidate above the daily cloud at 1.2572, which could set the stage for upward momentum.

If buyers fail and a reversal occurs, the market will likely return to the daily cloud and head toward support levels. The first key support on this path is the daily short-term trend at 1.2484. After that, the market will encounter additional reinforced supports from the daily cross, along with monthly levels at 1.2425 and 1.2301, and a weekly level at 1.2368.

This image is no longer relevant

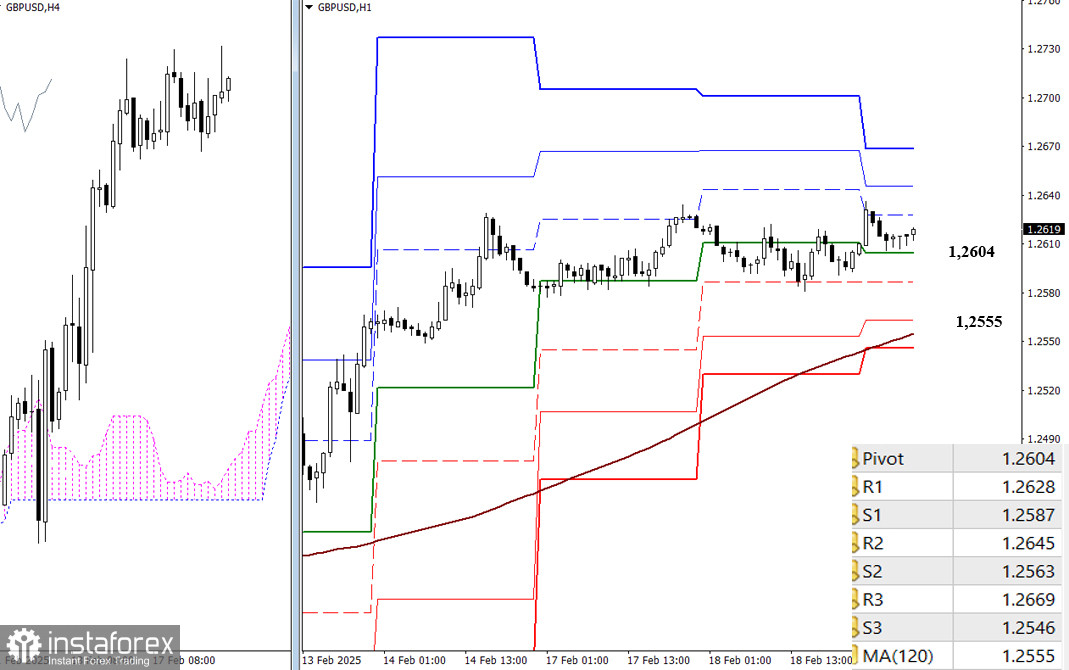
In recent days, GBP/USD has mainly shown sideways movement, indicating market uncertainty. The upside targets are the classic Pivot resistance levels at 1.2628, 1.2645, and 1.2669.

If the price starts to decline, the key downside target will be the weekly long-term trend at 1.2555. A breakout could shift the market balance. A confirmed breakdown beneath this level would strengthen bearish sentiment and give sellers a market advantage. Additionally, important intraday support levels include the classic Pivot levels at 1.2587, 1.2563, and 1.2546.

***

Technical Analysis Components:
  • Higher Timeframes: Ichimoku Kinko Hyo (9.26.52) and Fibonacci Kijun levels
  • H1: Classic Pivot Points and 120-period Moving Average (weekly long-term trend)

Recommended Stories

Bitcoin. El logro de nuevos máximos puede detenerse

El precio del Bitcoin superó momentáneamente el nuevo nivel histórico de 111 000, pero no logró consolidarse por encima de él. El apoyo proviene, tanto para él como para

Pati Gani 10:53 2025-05-22 UTC+2

EUR/USD. El 12 de mayo. El conflicto en Ucrania podría llegar a su fin.

Buenos días, estimados traders. El par EUR/USD el viernes subió hacia la zona de resistencia 1,1265 – 1,1282, rebotó desde allí y giró a favor del dólar estadounidense. El proceso

Samir Klishi 10:27 2025-05-12 UTC+2

Pronóstico para el gas al 8 de abril de 2025

Gas natural (NG) Ni al final de la semana pasada, ni mucho menos al comienzo de la actual, la cotización del gas natural logró superar la resistencia de 4.200, reforzada

Laurie Bailey 08:11 2025-04-08 UTC+2

Pronóstico del gas para el 17 de marzo de 2025

Gas natural (NG) La jornada de hoy se abrió por encima de la línea indicadora Kruzenshtern en el marco diario. Al mismo tiempo, el oscilador Marlin cambió de dirección hacia

Laurie Bailey 07:02 2025-03-17 UTC+2

Pronóstico para el Bitcoin el 21 de febrero de 2025

Bitcoin El Bitcoin ha cambiado de opinión sobre el desarrollo de una caída hacia soportes objetivos cómodos, y en su lugar, siguiendo el sentimiento de riesgo general, ha revertido desde

Laurie Bailey 07:23 2025-02-21 UTC+2

Bitcoin - análisis técnico de la situación

Viernes, y el Bitcoin sigue esperando. Ninguna de las partes enfrentadas tiene prisa por presentarse y ser activa. En la incertidumbre actual, el posicionamiento de los principales índices de referencia

Evangelos Poulakis 07:45 2025-02-14 UTC+2

Previsión para el gas natural (GN) del 5 de febrero de 2025

En el gráfico semanal la semana pasada el precio se revirtió desde el nivel de soporte 3.017 - desde los máximos de septiembre 2024, agosto 2023, febrero 2023 y también

Laurie Bailey 07:51 2025-02-05 UTC+2

#NDX - análisis técnico de la situación

A finales del año pasado, el índice marcó un nuevo máximo histórico (22141), tras lo cual se detuvo la subida, comenzó la formación de la corrección y la consolidación. Ahora

Evangelos Poulakis 07:24 2025-02-04 UTC+2

Bitcoin 30 Enero - análisis técnico de la situación

A pesar de marcar un nuevo máximo la semana pasada (109986), el Bitcoin detuvo su tendencia alcista y comenzó a formar incertidumbre. Hasta ahora, el formato semanal ha proyectado

Evangelos Poulakis 07:24 2025-01-30 UTC+2

#SPX (contrato CFD sobre futuros del SP500). Esperamos que la subida continúe

El contrato CFD sobre futuros del S&P 500 se recupera vigorosamente tras una caída local del lunes por la oleada de noticias sobre el éxito de la empresa china DeepSeek

Pati Gani 11:06 2025-01-29 UTC+2
¿No puede hablar ahora mismo?
Ingrese su pregunta en el chat.
 

Dear visitor,

Your IP address shows that you are currently located in the USA. If you are a resident of the United States, you are prohibited from using the services of InstaFintech Group including online trading, online transfers, deposit/withdrawal of funds, etc.

If you think you are seeing this message by mistake and your location is not the US, kindly proceed to the website. Otherwise, you must leave the website in order to comply with government restrictions.

Why does your IP address show your location as the USA?

  • - you are using a VPN provided by a hosting company based in the United States;
  • - your IP does not have proper WHOIS records;
  • - an error occurred in the WHOIS geolocation database.

Please confirm whether you are a US resident or not by clicking the relevant button below. If you choose the wrong option, being a US resident, you will not be able to open an account with InstaTrade anyway.

We are sorry for any inconvenience caused by this message.