یہ بھی دیکھیں

 25.02.2026 11:52 AM
The EUR/USD pair rebounded from the 61.8% corrective level of 1.1770 on Tuesday, reversed in favor of the European currency, and began rising toward the 50.0% Fibonacci level of 1.1830. A rebound from the 1.1830 level today would favor the U.S. dollar and a resumption of the decline toward 1.1770. If the pair consolidates above 1.1830, traders may expect continued growth toward the next corrective level of 38.2% – 1.1889.

The wave situation on the hourly chart remains simple. The last completed downward wave broke the low of the previous wave, while the last upward wave did not even come close to the previous peak. Thus, the trend remains "bearish." The bulls have taken a pause within what could have been a large-scale offensive—one that would have been impossible without Donald Trump—and this pause has dragged on significantly. However, the U.S. president's effective refusal to comply with the Supreme Court's ruling could bring the bulls back into the market.
On Tuesday, the news background was virtually absent. The only report, ADP for the week, triggered no market reaction—and it shouldn't have. However, if there is some calm in the market now, it is temporary. Donald Trump continues to keep his hand "on the red button," the pressing of which would launch a large-scale military operation in Iran. Yesterday, during his annual address to Congress, Trump once again accused Iran of developing nuclear missiles. According to him, Tehran already has the capability to deliver nuclear strikes on Europe and will soon obtain missiles capable of hitting American cities. As U.S. president, he will not allow what he calls the world's sponsor of terrorism and a regime responsible for killing thousands of people (including American soldiers) to possess nuclear missiles. Thus, the U.S. leader once again confirmed that if the talks fail in the near future, this would mean a military operation in Iran. The next round of negotiations will take place in Geneva on Thursday. In my view, the likelihood of Tehran abandoning its nuclear weapons program is close to zero.
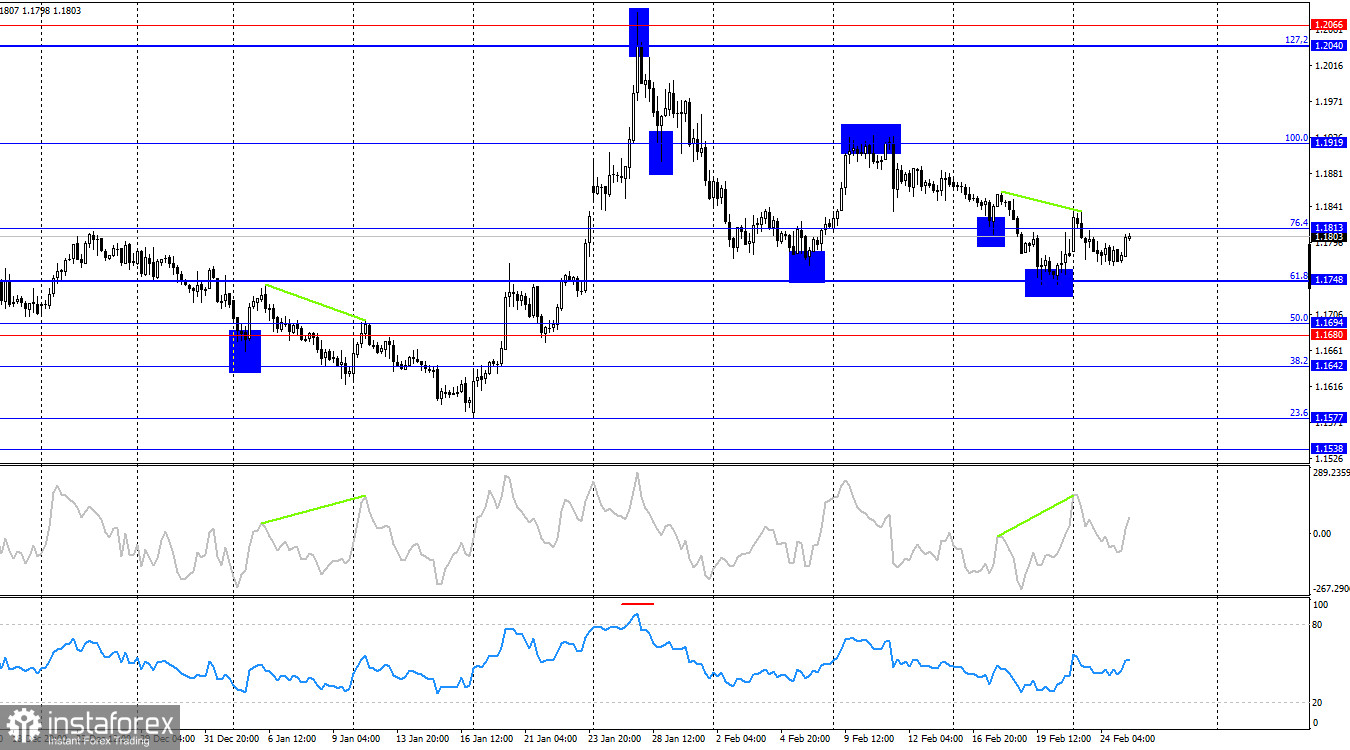
On the 4-hour chart, the pair reversed in favor of the U.S. dollar after a "bearish" divergence formed on the CCI indicator. As of Wednesday morning, the pair returned to the 76.4% corrective level of 1.1813. A rebound from this level would push quotes back into a downward channel toward the 61.8% Fibonacci level of 1.1748. Consolidation above 1.1813 would increase the probability of further growth toward the 100.0% corrective level of 1.1919. No emerging divergences are currently observed on any indicator.
Commitments of Traders (COT) Report:
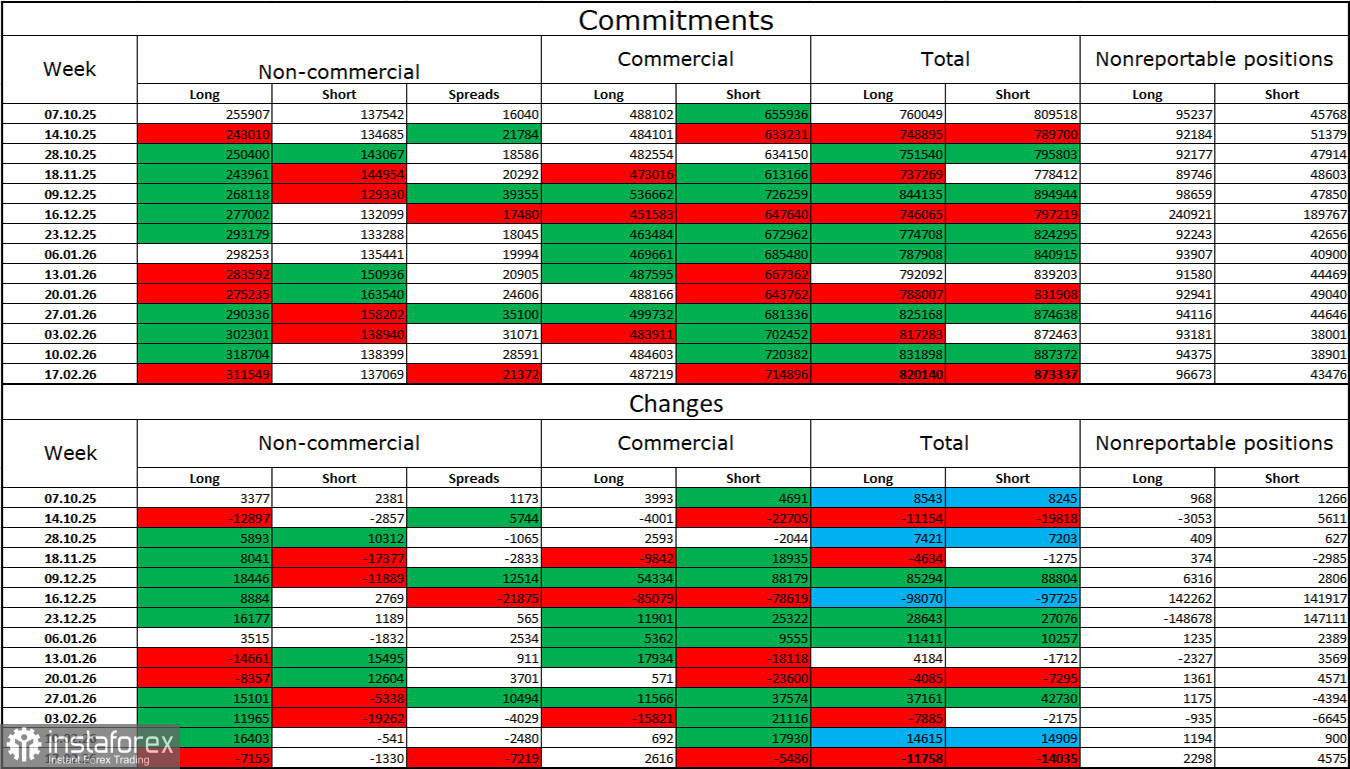
During the last reporting week, professional traders closed 7,155 long contracts and 1,330 short positions. The sentiment of the "Non-commercial" group remains bullish thanks to Donald Trump and his policies, and it continues to strengthen over time. The total number of long positions held by speculators now stands at 312,000, while short positions total 137,000—more than a twofold advantage for the bulls.
For thirty-three consecutive weeks, large players were reducing short positions and increasing long ones. Then came the "shutdown," and now we are observing the same pattern again: professional traders continue building up long positions. Donald Trump's policy remains the most significant factor for traders, as it creates numerous long-term structural problems for America—for example, a serious deterioration in the labor market (in 2025), a decline in global reputation, and capital outflows from the United States. Traders also fear a potential loss of Federal Reserve independence in 2026 and Donald Trump's geopolitical ambitions.
News Calendar for the U.S. and the European Union:
On February 25, the economic calendar contains three secondary entries. The impact of the news background on market sentiment on Wednesday may be extremely weak.
EUR/USD Forecast and Trading Tips:
Selling the pair was possible after a rebound from 1.1830 on the hourly chart, with targets at 1.1770 and 1.1696. The first target was reached. New short positions may be considered upon another rebound from 1.1830 with the same targets. Buying was possible after a rebound from 1.1770 on the hourly chart with targets at 1.1830 and 1.1889. These trades can be kept open today.
Fibonacci levels are drawn from 1.1805–1.1578 on the hourly chart and from 1.1919–1.1471 on the 4-hour chart.


