
یہ بھی دیکھیں


 20.11.2026 06:34 AM
The minutes of the Federal Reserve's October meeting were released Wednesday evening. Two important points up front. First — as expected — the market barely reacted. Second — Fed minutes are inherently formal because they are published three weeks after the meeting. Over three weeks (almost a month!) a number of important U.S. reports typically arrive — on the labor market, unemployment, inflation, business activity, GDP, and so on. Therefore, you cannot assume the FOMC's mood in October is the same as it is today. In mid-November the committee's October stance is largely irrelevant.
And what difference does it make what that stance was three weeks ago if the dollar has been rising over those three weeks? Even if the FOMC was "more hawkish" in October, what changes if the dollar is already rising every day regardless? So the November release of the minutes had no real significance from the start. Still, as we have said, many analysts need something to write about and to explain the persistent dollar rally — so the Fed minutes get used for that purpose too.
It turned out that "in fact" the October meeting was "very hawkish," even though the Fed left rates unchanged. "In fact," nearly all officials did not intend to stop tightening—they just took a pause. Most participants felt a pause was increasingly risky because inflation could become entrenched and then require much greater effort to return to 2%. The majority agreed further tightening would be needed in the future. But what is new in this for traders if the market is already pricing a rate rise in March?
Over the past two weeks, many FOMC officials have spoken repeatedly, so the market is well aware the Fed will hike in December and likely at least once more by March 2027. In other words, the Fed is already priced as highly hawkish; the October minutes were drafted before the latest inflation, labor, and GDP data and could not have been as aggressively hawkish as the Fed looks today.
Conclusion: neither the Fed minutes nor the Fed's policy prospects logically explain three months of dollar appreciation. The real issue is that the market ignores virtually all other factors. Still, we must work with what we have, and it's pointless to argue that the market is "wrong." The question is when this illogical dollar advance will end. In our view, we may see a repeat of 2022: the dollar fell once inflation began to slow, and the market realized the Fed would soon stop tightening and begin easing. We expect a similar dynamic could unfold this time as well.
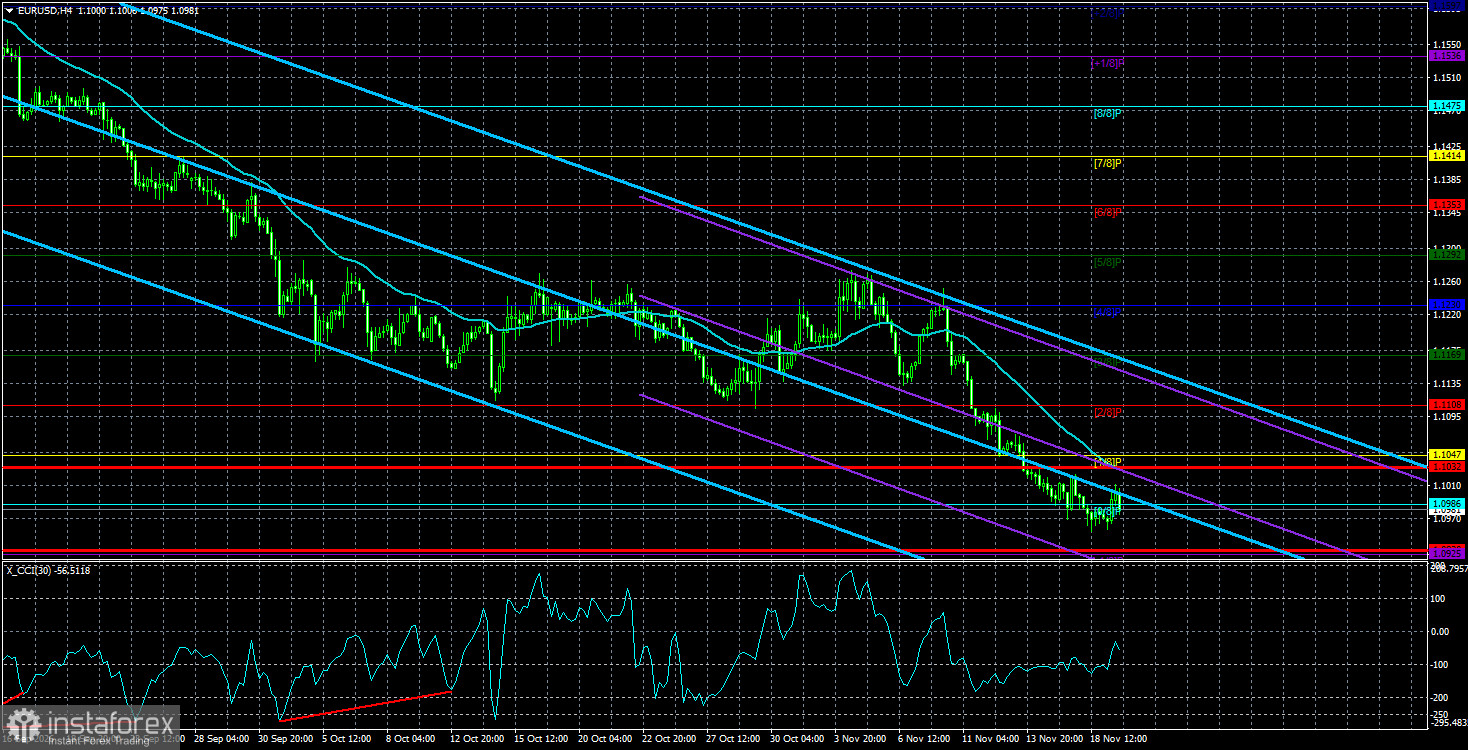
The EUR/USD pair remains in a downtrend with insufficient fundamental, macroeconomic, or geopolitical justification. The global fundamental backdrop for the dollar is negative, but in 2026, geopolitics first and then the Fed's hawkish stance provided strong support for the U.S. currency. Practically all other factors have been ignored over the past three months. With price below the moving average, consider shorts with targets of 1.0928 and 1.0925, since the trend remains downward. Above the moving average, consider long positions with targets of 1.1108 and 1.1169, because the illogical decline will eventually end.
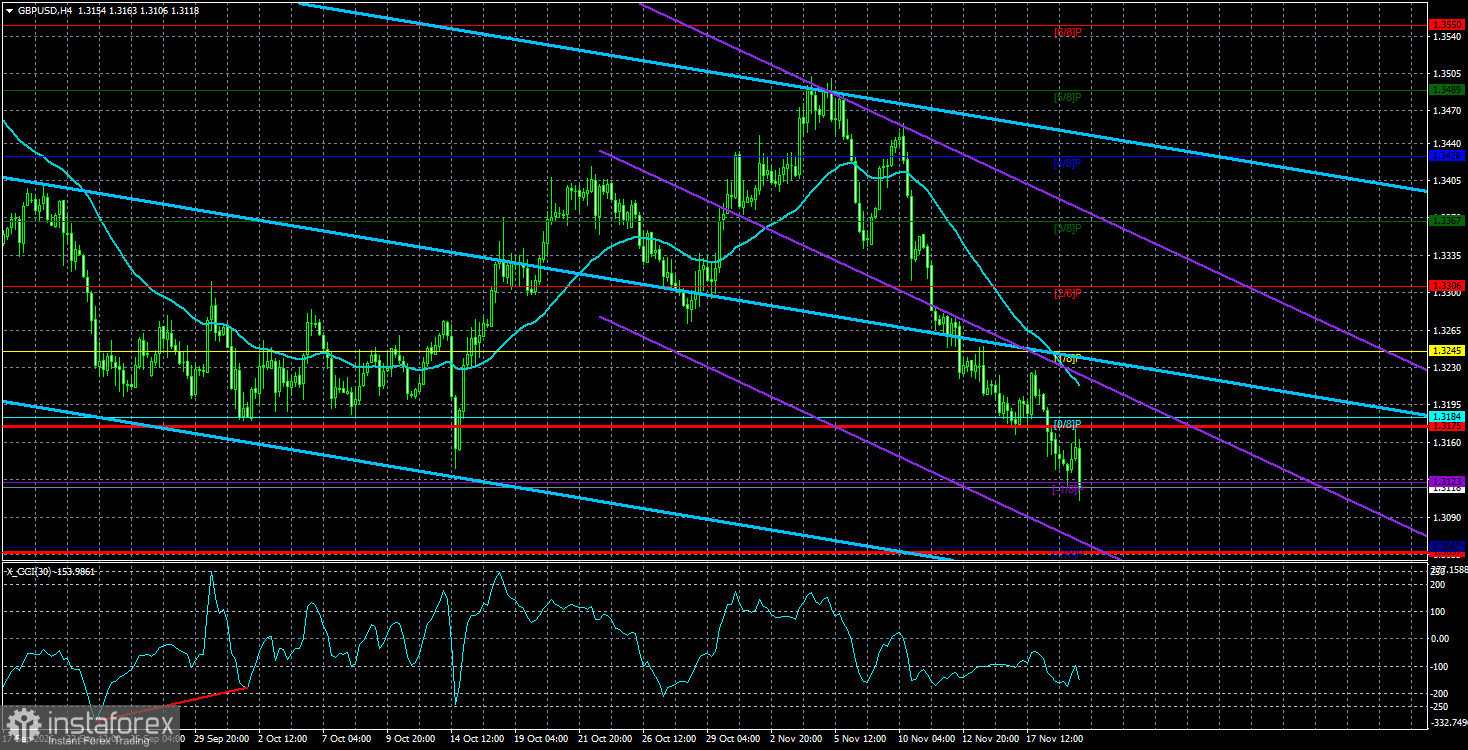
The GBP/USD pair has begun a new downward trend within a sideways channel on the daily timeframe. 2026 has been very positive for the dollar because geopolitics and inflation pushed capital to safety and prompted the Fed to return to tightening. However, on the weekly timeframe, price remains flat between 1.3150 and 1.3780 within a four-year uptrend, supporting the prospect of pound appreciation in the medium term. Consider long positions with targets of 1.3306 and 1.3367 when price is above the moving average. With price below the moving average, trade to the downside with targets of 1.3062 and 1.3057. Be cautious with short positions — price is near the lower bounds of the sideways channels.


