আরও দেখুন

 17.03.2023 09:05 AM
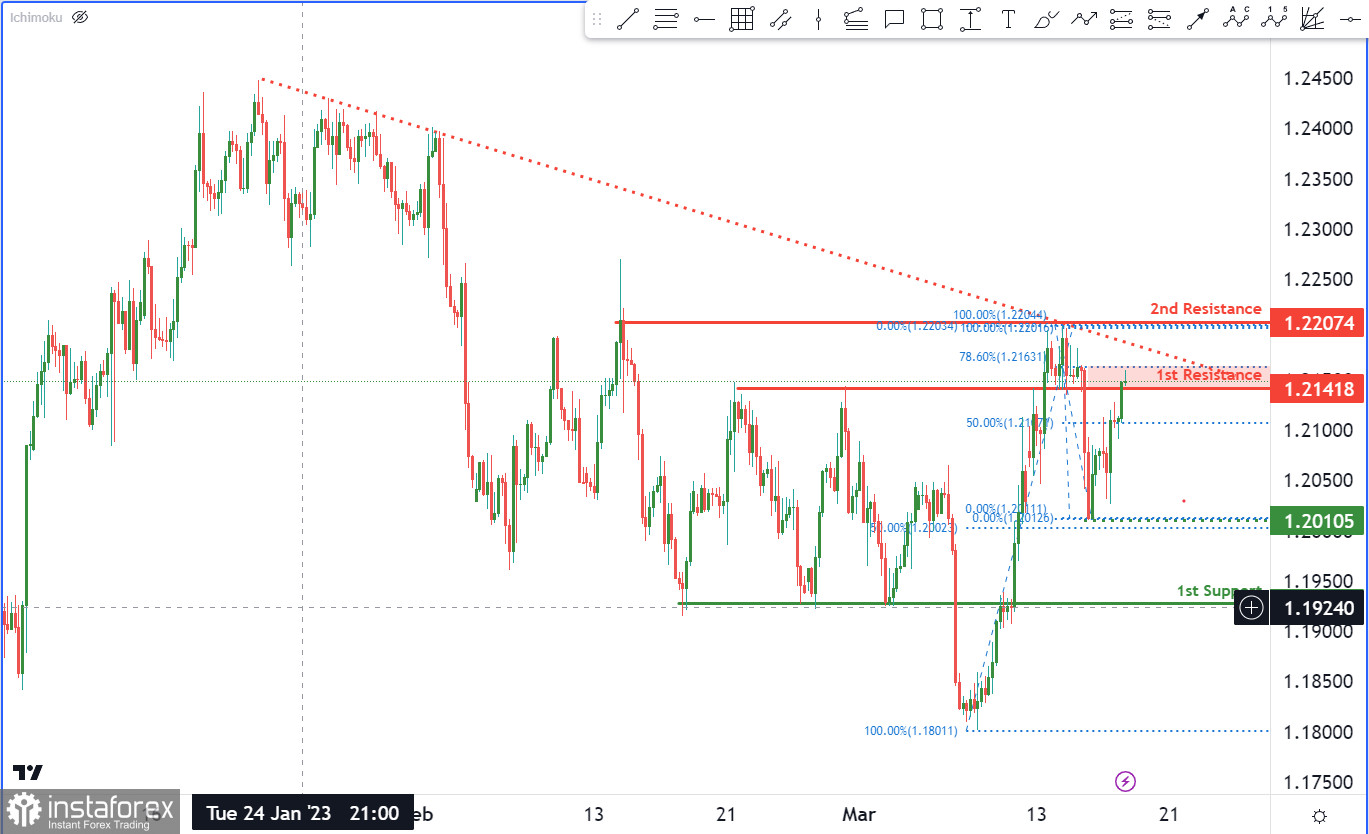
The GBP/USD chart currently exhibits bearish momentum, as the price remains below a significant descending trend line. This indicates that the currency pair may undergo further downward pressure in the near future.
In case the price rises, it could face a potential bearish reaction at the 1st resistance level and subsequently drop towards the 1st support. The 1st support level, situated at 1.1927, is a robust overlap support. Additionally, the intermediate support level at 1.2010, which corresponds to a swing low support and a 50% Fibonacci retracement, could also serve as a crucial level to monitor.
Conversely, if the price breaks above the 1st resistance level at 1.2141, it may advance towards the 2nd resistance level located at 1.22074, which represents a multi-swing high resistance.
You have already liked this post today
*এখানে পোস্ট করা মার্কেট বিশ্লেষণ আপনার সচেতনতা বৃদ্ধির জন্য প্রদান করা হয়, ট্রেড করার নির্দেশনা প্রদানের জন্য প্রদান করা হয় না।


