আরও দেখুন

 04.12.2023 06:15 AM
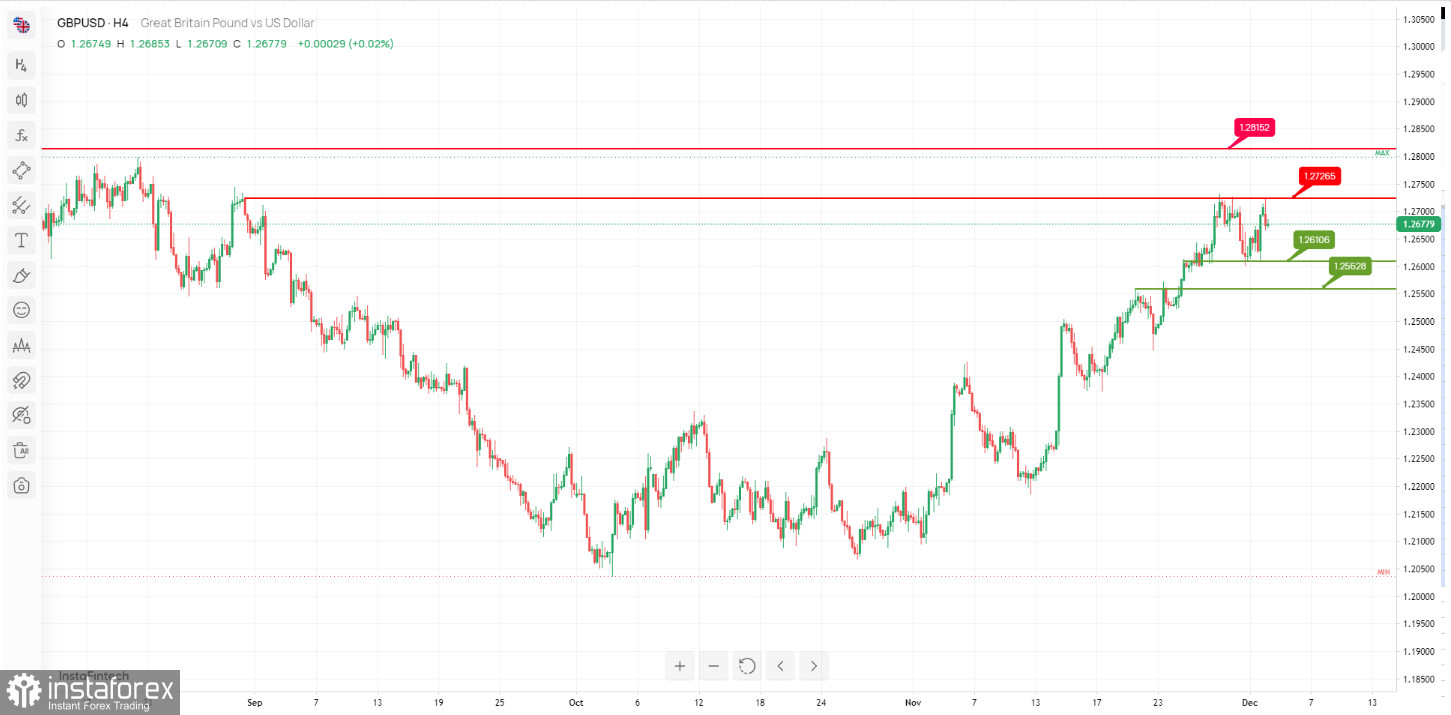
The GBP/USD chart is indicating the potential for a bearish reversal, with significant support and resistance levels shaping its prospective direction.
Resistance Levels:
The 1st resistance at 1.27265 is characterized as "Multi-swing high resistance." This level acts as a substantial barrier to any potential upward price movement, making it a key consideration for traders. Additionally, the 2nd resistance level at 1.28152 is identified as "Swing high resistance," reinforcing its role as a significant resistance zone due to its alignment with key technical levels.
Support Levels:
On the support side, the 1st support level at 1.26106 is labeled as "An Overlap support." This level implies a zone where buying interest may emerge, potentially acting as a safeguard against further declines. Complementing this, the 2nd support level at 1.25628 is characterized as "Pullback support," indicating its potential to stabilize price movements.
You have already liked this post today
*এখানে পোস্ট করা মার্কেট বিশ্লেষণ আপনার সচেতনতা বৃদ্ধির জন্য প্রদান করা হয়, ট্রেড করার নির্দেশনা প্রদানের জন্য প্রদান করা হয় না।


