আরও দেখুন

 04.12.2023 06:17 AM
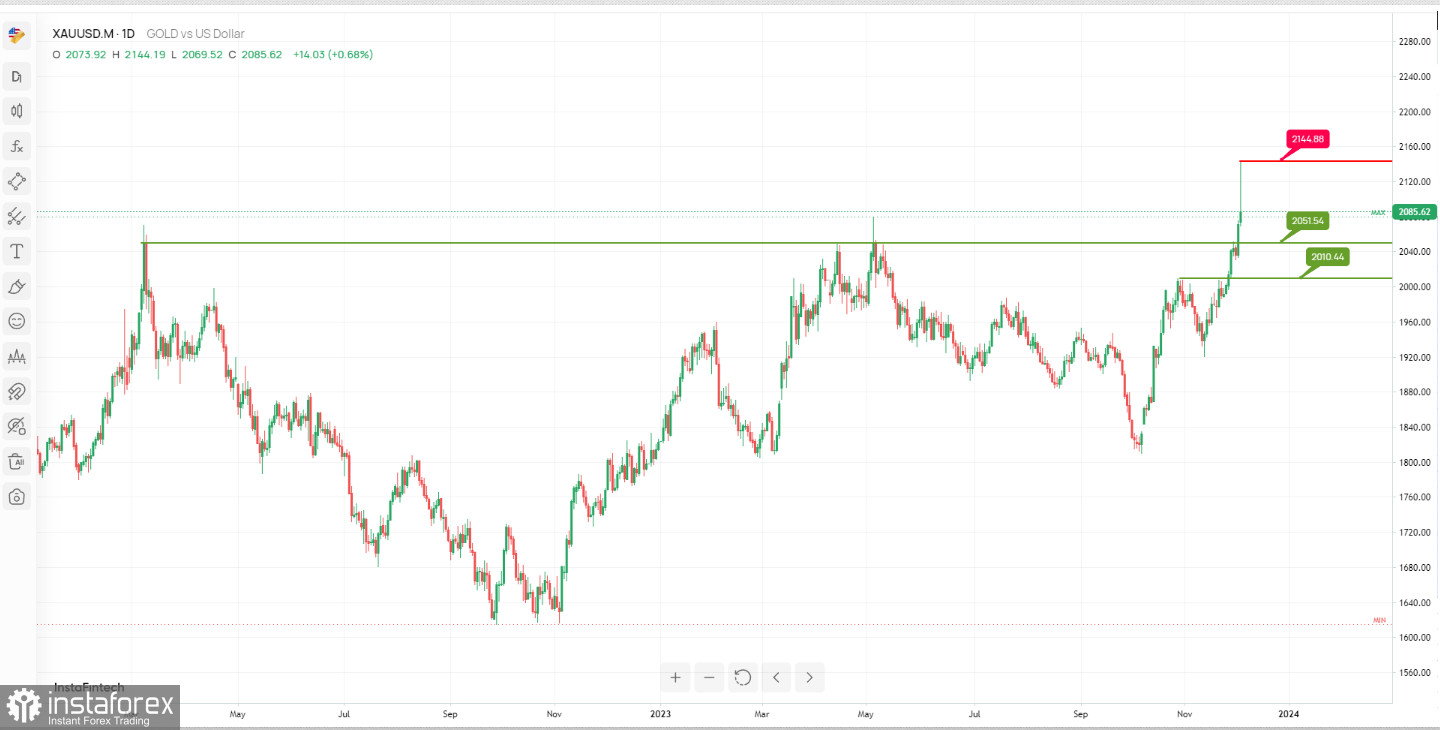
The XAU/USD chart suggests the potential for a bullish bounce, with significant support and resistance levels in focus.
Support Levels:
At 2051.54, the 1st support is identified as "Pullback support." This level implies a zone where buying interest may emerge, potentially facilitating a bounce. Similarly, the 2nd support at 2010.44 is characterized as "Pullback support," reinforcing its potential role in stabilizing price movements.
Resistance Levels:
On the resistance side, the 1st resistance level at 2144.88 is labeled as "Swing high resistance." This level represents a significant barrier to further upward price movement
You have already liked this post today
*এখানে পোস্ট করা মার্কেট বিশ্লেষণ আপনার সচেতনতা বৃদ্ধির জন্য প্রদান করা হয়, ট্রেড করার নির্দেশনা প্রদানের জন্য প্রদান করা হয় না।


