আরও দেখুন

 18.01.2024 05:45 AM
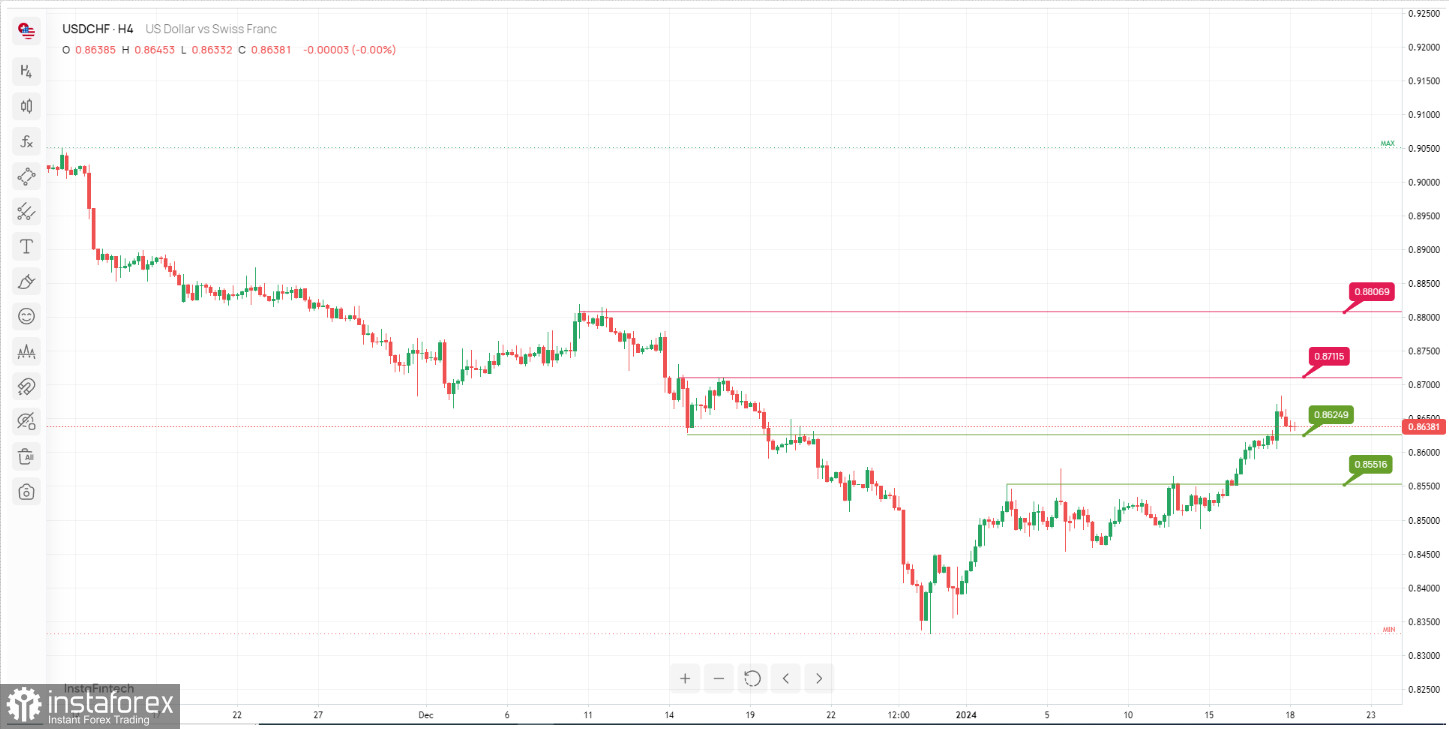
The USD/CHF chart suggests a potential bullish scenario with a focus on a continuation towards the resistance levels. Here are the key support and resistance levels:
Resistance Levels:
The 1st resistance level at 0.8711 is identified as a "Pullback resistance". This level could act as a barrier to further upward movement.
The 2nd resistance level at 0.8806 is also labeled as a "Pullback resistance". It represents another level where selling pressure could emerge and hinder the price from moving higher.
Support Levels:
The 1st support level at 0.8624 is a significant support zone, marked as "An Overlap support". This level may attract buying interest and potentially act as a floor for the price.
The 2nd support level at 0.8551 is labeled as a "Pullback support". It serves as an additional support zone where traders might consider entering long positions.
You have already liked this post today
*এখানে পোস্ট করা মার্কেট বিশ্লেষণ আপনার সচেতনতা বৃদ্ধির জন্য প্রদান করা হয়, ট্রেড করার নির্দেশনা প্রদানের জন্য প্রদান করা হয় না।


