
আরও দেখুন


 26.10.2026 11:22 AM
The four-hour chart (H4) for the gold symbol (GOLD) shows a clear negative price movement dominated by downward momentum, as the price is currently trading at 4016.95 levels, trying to stabilize following a sharp downward wave that led to the breaking of pivotal and important support levels in the short and medium term.
Technical reading and price action
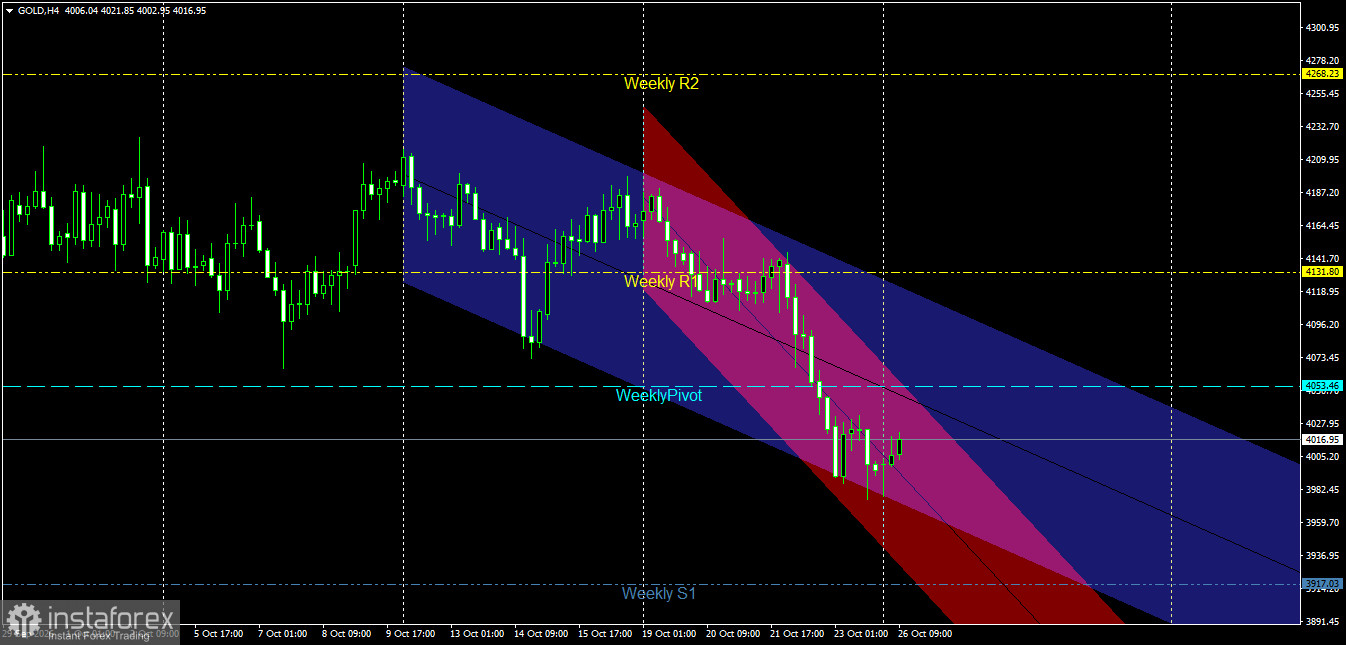
Structure of price channels: The price moves within a broad descending main channel (in blue) that reflects the prevailing general trend, and is intersected by a steep descending sub-channel (in pink/red). It is noted that the price has broken the middle line of the main channel and has penetrated several anchor levels to now be positioned near the lower border of the secondary channel, which reflects the strength of the selling pressure and the bears' control over the course of trading.
Interaction with the weekly pivot levels: The price suffered a strong and direct break of the Weekly Pivot point located at 4053.46, which turned from previous support levels into a major resistance barrier pressuring prices negatively. This decline comes after the price failed to breach the first weekly resistance level (Weekly R1) at 4131.80, and is currently heading towards targeting the first weekly support level (Weekly S1) at 3917.03.
Pivotal support and resistance levels
Main resistance levels:
First resistance: 4053.46 level (Weekly Pivot point and the most important intraday resistance).
Second resistance: 4131.80 level (Weekly R1 resistance level).
Pivotal resistance: 4268.23 level (Weekly R2).
Main support levels:
First support: levels 4000.00 - 4005.20 (psychological barrier and nearby intraday support).
Second support: 3917.03 level (Weekly S1 support level).
Pivotal support: 3891.45 levels and below (extended lower borders of descending channels).
Price action forecasts and trading recommendations
Bearish scenario (main):
A downside trend is considered the likely path as long as trading settles below the weekly pivot point of 4053.46.
Recommendation: It is preferable to sell with bullish corrective bounces near 4030.00 - 4053.46 as long as they are not breached higher.
Technical objectives: Breaking the 4000.00 barrier and completing the decline to target the first weekly support level at 3917.03.
Corrective bullish scenario (alternative):
It is activated only if purchasing forces succeed in rebounding and exceeding the weekly pivot point with a strong positive candle.
Verification condition: 4-hour candle closes above 4053.46.
Technical objectives: Opening the way for a retest of the first weekly resistance level at 4131.80.
Risk management
Trading with downward acceleration and high volatility requires strict adherence to capital management rules, setting the risk rate not to exceed a maximum of 2% per trade, and carefully placing stop-loss orders to protect the portfolio from sudden reversals.
Price Action on the Daily Gold Chart:
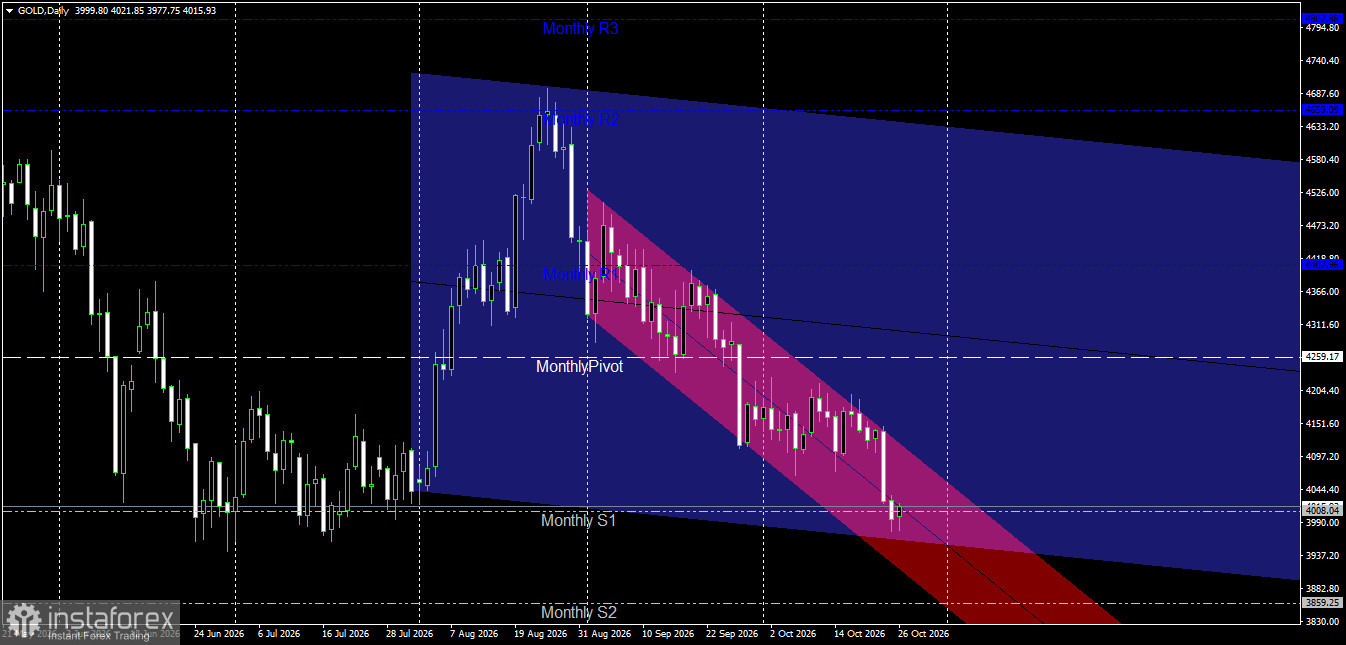
The price is currently trading at 4017.36 within a descending channel on the daily timeframe. It continues to decline, reflecting persistent, intense selling pressure as it remains below key pivot levels.
Analysis of the Last Two Candles:
Friday's Candle: Reflected clear selling pressure and a sharp decline, moving toward a test of the lower boundary of the descending channel and nearby support zones.
Today's Candle: Shows continued negative momentum, with the price pushing toward the psychological barrier of 4000.00 and drawing very close to the first monthly support level (Monthly S1) at 4008.04.
Outlook for Future Movement:
Bearish Scenario (Primary): This remains the dominant and most likely outlook as long as the price holds below the monthly pivot point and nearby resistance levels. A confirmed break below the current support level could lead to further declines toward deeper support zones.
Bullish Scenario (Alternative): This would require the emergence of significant buying pressure, triggering a reversal and a successful stabilization above nearby technical resistance levels, potentially shifting the price back into a corrective phase.


