
আরও দেখুন


 04.11.2026 12:49 PM
The four-hour (H4) chart for Silver (SILVER) shows active, positive price movement. Currently trading at 52.030, the price is making a serious attempt to recover and break out of the bearish trend that has dominated recent trading, aiming to breach the boundaries of the existing downward channels and key pivot levels.
Technical Analysis and Price Action:
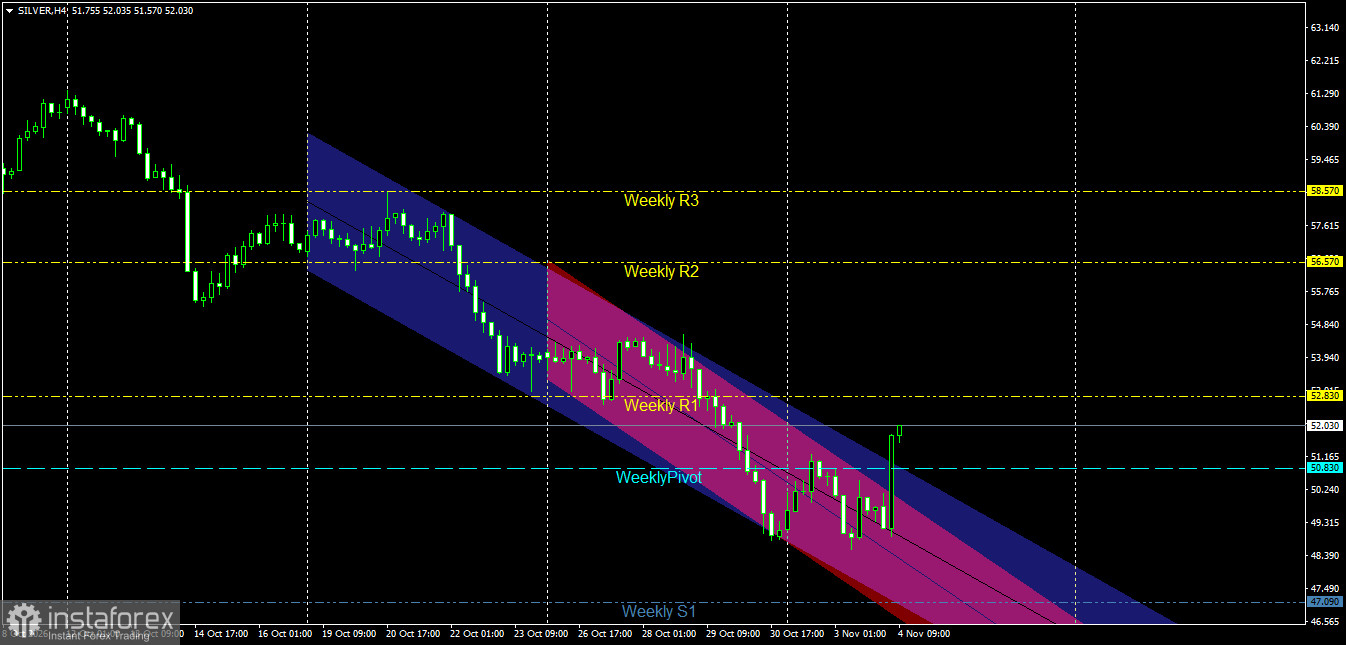
Price Channel Structure: The price is trading near the upper boundary of both the primary bearish channel (in blue) and the secondary bearish channel (in pink/red). Notably, the price has formed a higher local low and surged upward with a strong bullish candle that broke through the upper boundary of the secondary channel. This reflects a gradual shift in momentum in favor of the buyers (the bulls) and an attempt to dismantle the previously established bearish structure.
Interaction with Weekly Pivot Levels: The price has successfully broken above the weekly pivot point at 50.830 and has managed to consolidate above it. This breakout serves as a strong positive signal, paving the way for a move toward the first weekly resistance level (Weekly R1) at 52.830—a key near-term target.
Key Support and Resistance Levels:
Primary Resistance Levels:
First Resistance: 52.830 (the first weekly resistance level, Weekly R1, and the immediate upside target).
Second Resistance: 56.570 (the second weekly resistance level, Weekly R2). Pivotal Resistance: 58.570 (Weekly R3 level).
Key Support Levels:
First Support: 50.830 (Weekly Pivot point, now acting as a support level).
Second Support: 49.315 – 48.390 (Previous intraday lows).
Pivotal Support: 47.090 (Weekly S1 level and the lower boundary of the price range).
Price Action Outlook and Trading Recommendations:
Bullish Scenario (Primary):
A positive trajectory is currently the most likely outcome, provided the price remains stable and continues to trade above the weekly pivot point of 50.830 and the boundaries of the breakout channel.
Recommendation: It is advisable to buy during corrective pullbacks toward the 51.200 – 50.830 range, as long as these levels hold.
Technical Targets: Aim to retest and surpass the first weekly resistance at 52.830, followed by an extension toward 54.800, eventually reaching the 56.570 level.
Bearish Scenario (Alternative):
This scenario is triggered if selling pressure returns, the price fails to sustain its current gains, and it falls back into the descending channels.
Confirmation Condition: A clear 4-hour candle close below the weekly pivot point of 50.830. Technical Targets: A pullback toward the intraday support levels at 49.315, followed by the first weekly support level at 47.090.
Risk Management
Trading in the silver and commodities markets requires strict adherence to capital management rules, given the high price volatility. Risk per trade should be limited to a maximum of 2%, and stop-loss orders must be precisely implemented to protect the investment portfolio.
Price Action on the Daily Silver Chart:
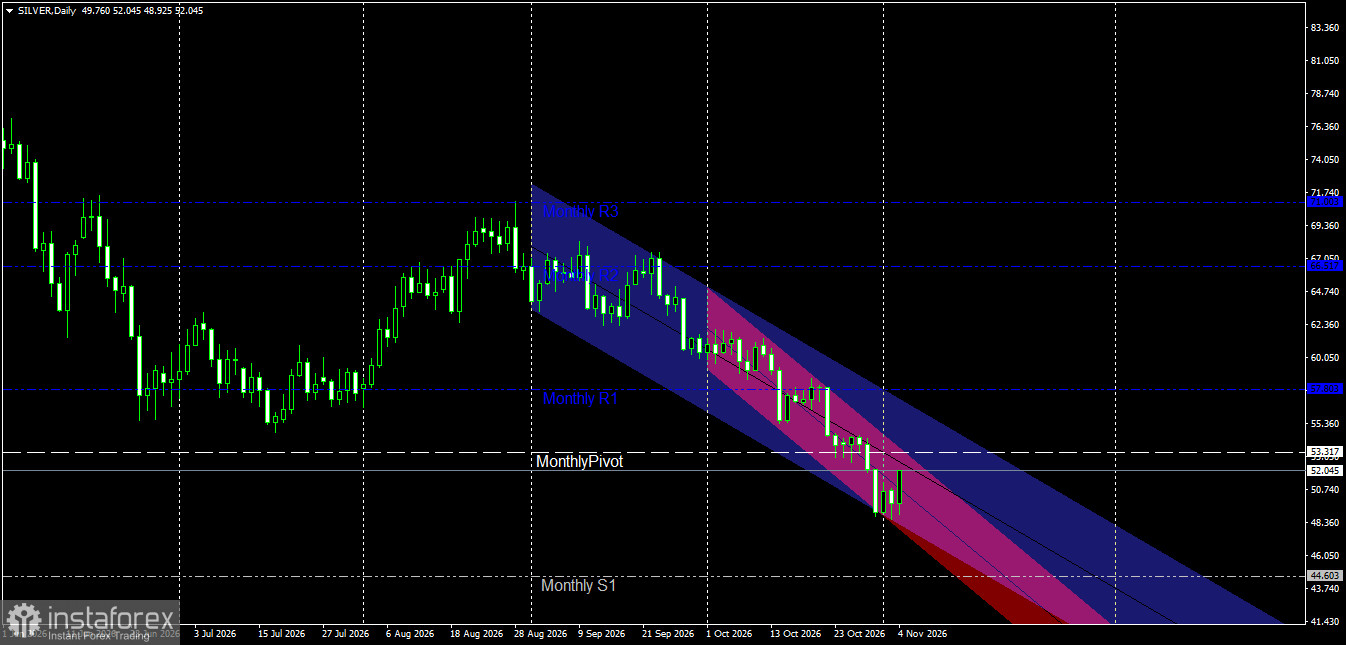
The price is currently trading at 52.045 within a descending channel on the daily timeframe, showing a corrective upward rebound after touching the lower boundary of the channel near the most recent local low.
Analysis of the Last Two Candles (Yesterday's and Today's):
Yesterday's Candle: Reflected a positive rebound (a bullish candle) following a successful bounce from the bottom of the descending channel, accompanied by a recovery in buying momentum.
Today's Candle: Indicates a continuation of the bullish effort and the positive rebound, as the price seeks to test nearby pivot levels.
Outlook for Future Movement:
Corrective Bullish Scenario (Most Likely): The positive rebound continues, targeting a test of the Monthly Pivot level at 53.317. If this level is broken and the price sustains a position above it, the corrective rally could extend toward the first Monthly Resistance (Monthly R1) at 57.803.
Bearish Scenario (Alternative): This scenario would be triggered if selling pressure returns and the current rebound fails, causing the price to retreat, break below the recent low, and head toward the first Monthly Support (Monthly S1) at 44.603.


