আরও দেখুন

 31.10.2025 10:02 AM
On Friday, the market may continue moving downward from the 1.1569 level (the closing price of yesterday's daily candle) toward the 1.1542 target — the lower fractal (yellow dotted line). Upon testing this level, a pullback movement upward toward 1.1556 is possible — a historical resistance level (blue dotted line).
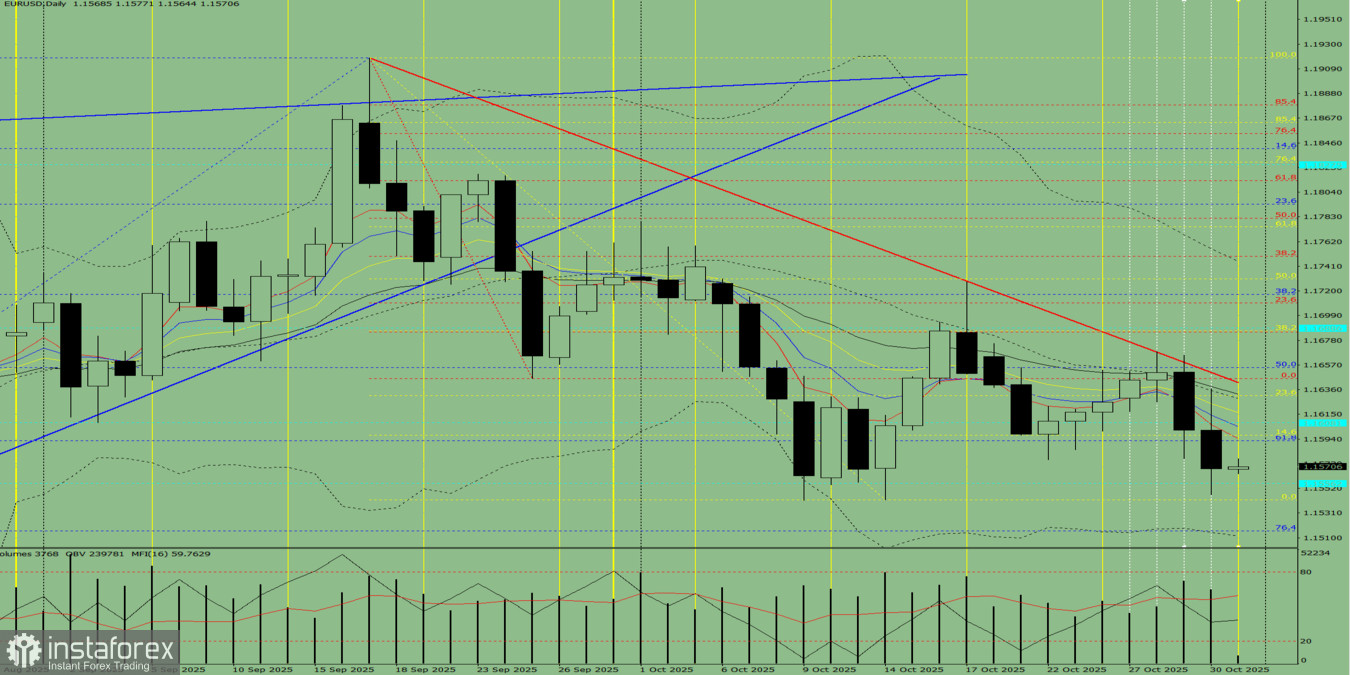
Fig. 1 (Daily Chart)
Overall conclusion: Downward trend.
Alternative scenario:Today, from the 1.1569 level (closing price of yesterday's daily candle), the price may start moving downward toward 1.1516 — the 76.4% retracement level (blue dotted line). Upon testing this level, a pullback upward movement toward 1.1542 — the lower fractal (yellow dotted line) — is possible.
You have already liked this post today
*এখানে পোস্ট করা মার্কেট বিশ্লেষণ আপনার সচেতনতা বৃদ্ধির জন্য প্রদান করা হয়, ট্রেড করার নির্দেশনা প্রদানের জন্য প্রদান করা হয় না।


