আরও দেখুন

 07.04.2026 09:54 AM
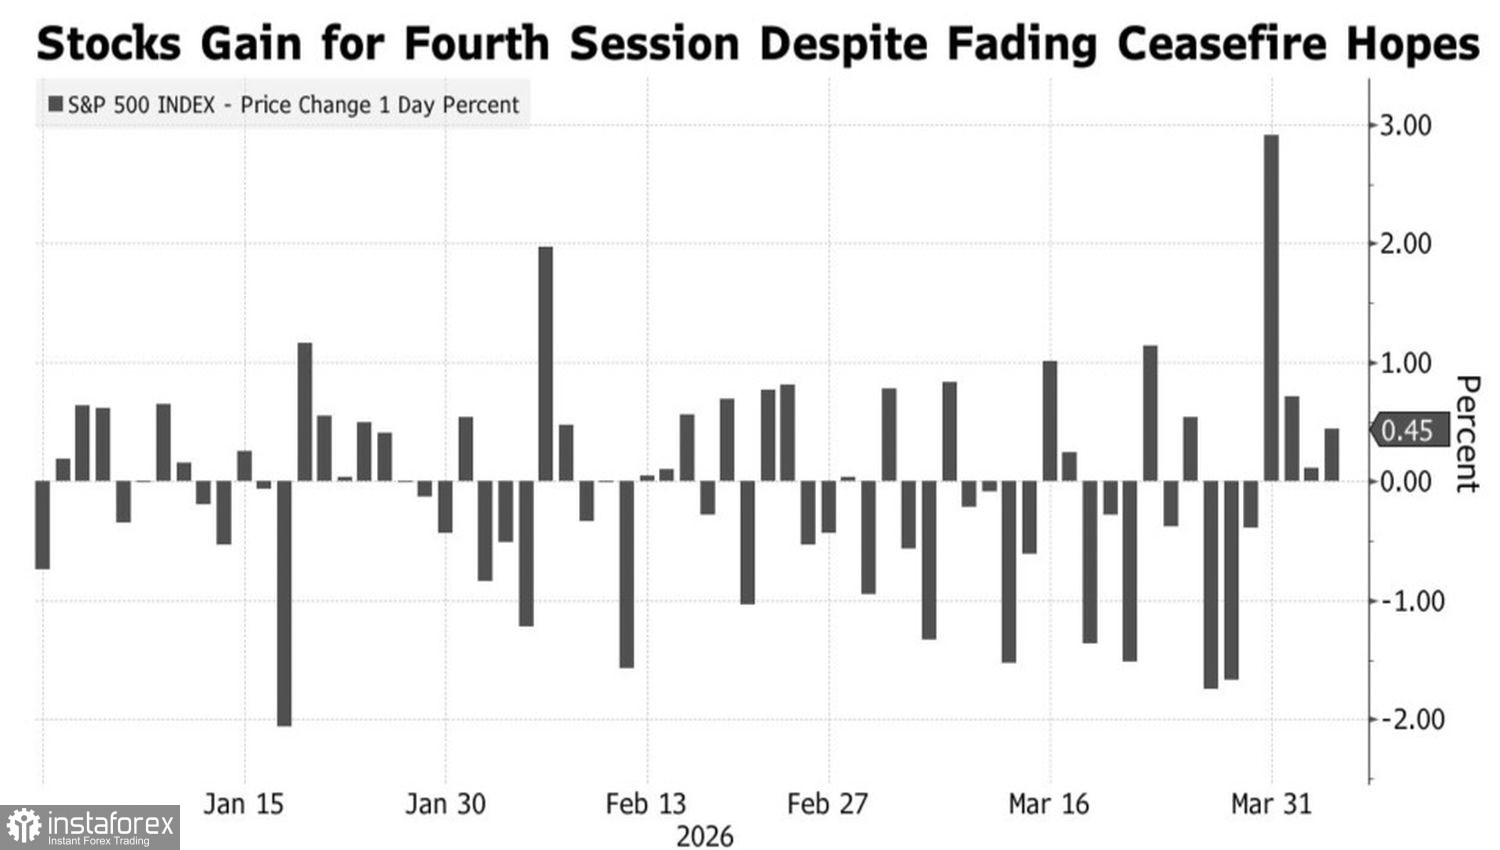
Markets, as the saying goes, have a habit of predicting nine of the last five recessions. Does a four-day S&P 500 rally mean the Middle East conflict is over? Donald Trump offered both carrot and stick: a 45-day truce if Iran reopens the Strait of Hormuz. Tehran rejected the proposal and presented a ten?point list of demands. The US president called them inadequate but said it was an important step.
S&P 500 performance
Geopolitics continues to drive markets, and with reason. According to Miller Tabak + Co.,when oil prices in the past rose by 60% and stayed high, the S&P 500 fell by about 20%, sometimes more. Since the start of 2026, Brent has added about 80%, and WTI — about 96%. Even after a full reopening of the Strait of Hormuz, production will take time to recover, so both benchmark crudes are likely to remain elevated for a long stretch. Does this doom the broad index?
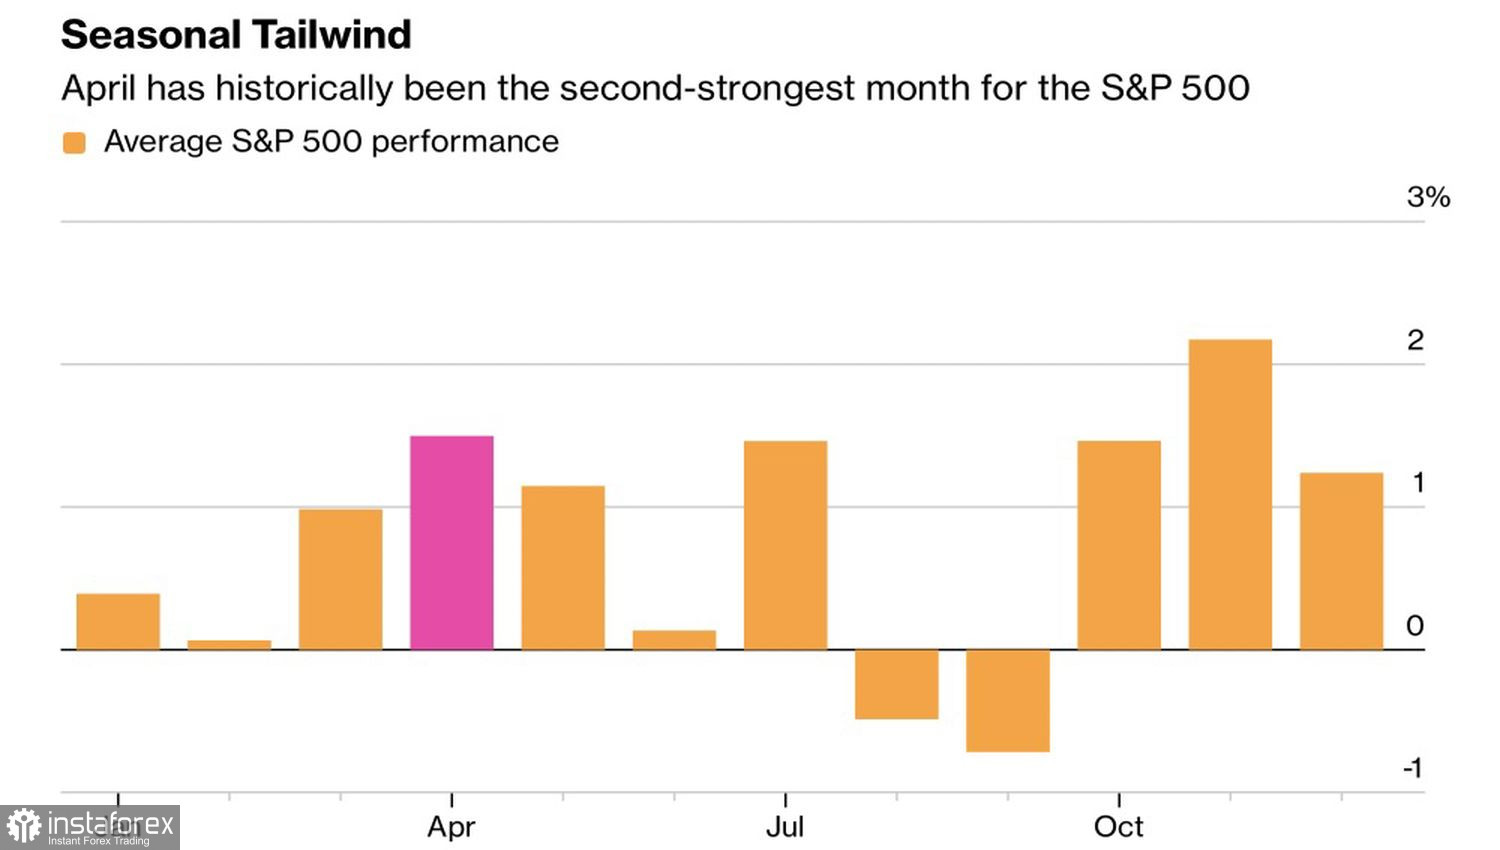
Other models suggest it does not. Seasonality favors the S&P 500. Historically, April is the second-strongest month of the year after November, partly because mid-spring tax payments leave households and companies with funds that often flow back into US equities.
Seasonal S&P 500 performance
Major banks and firms are flagging a buying opportunity. Morgan Stanley recommends increasing exposure to cyclicals and high-quality growth names, while Yardeni says it is time to buy Big Tech. Valuations have been reset: forward P/E for the Magnificent Seven has fallen to 20.6, nearly comparable with the S&P 500's forward P/E of 19.6. AI-driven productivity and massive investment remain a structural tailwind for tech companies.
Goldman Sachs notes positive flows from the so-called "fast money" cohort — trading advisers and volatility-driven strategies. That group sold global equities about $240 billion in March. Goldman estimates that fast money will buy roughly $55 billion of equities in April, including about $20 billion into US stocks.
Therefore, seasonality and short-term capital flows — especially from fast money — are working in the S&P 500's favor, yet history still sounds a warning: a sustained period of high oil prices is deeply unfavorable for the broad index. It feels out of sorts.
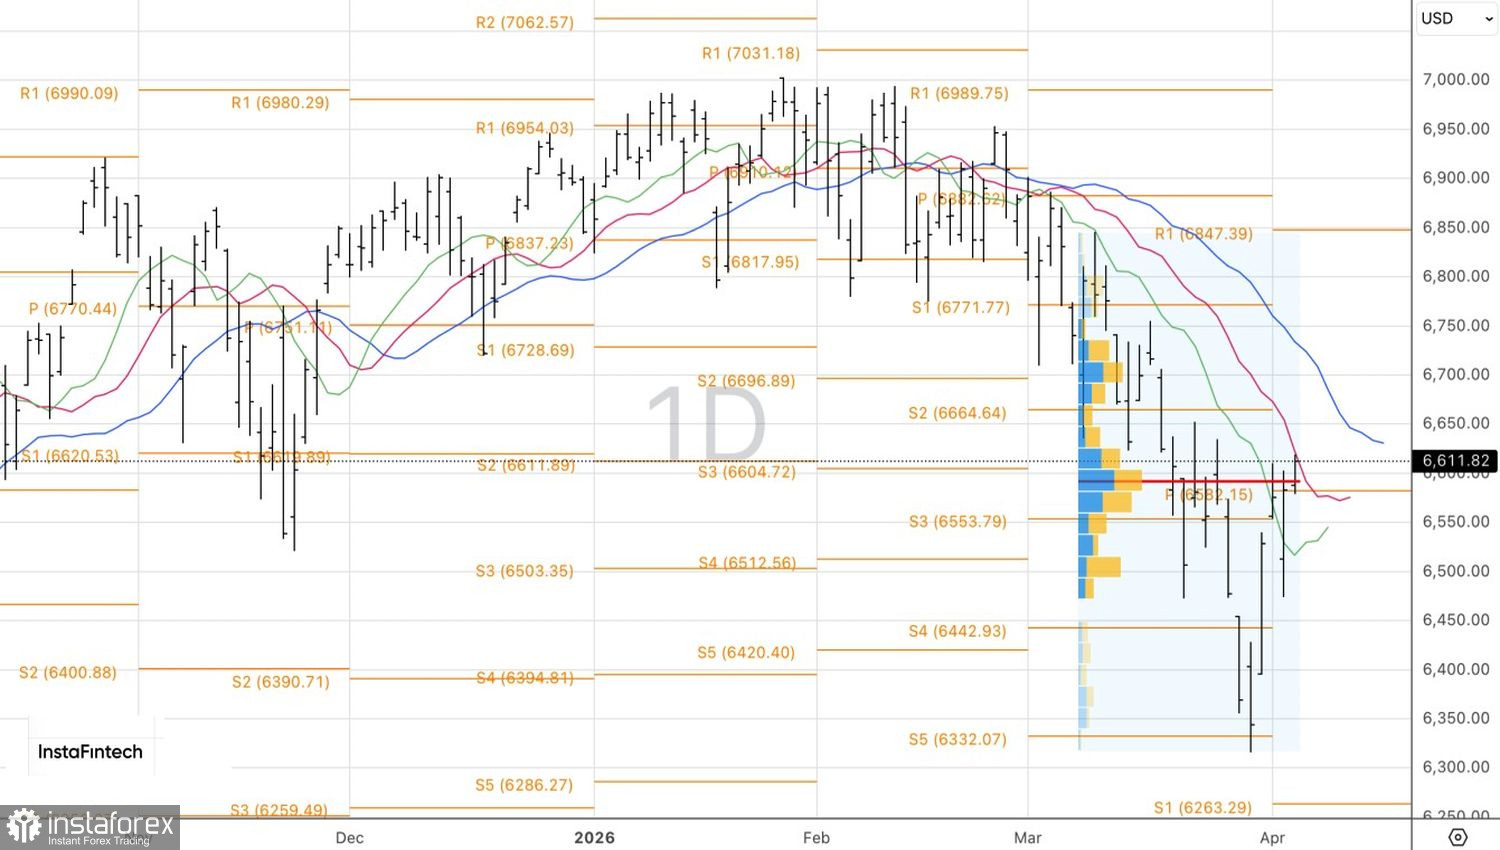
Technically, the daily chart shows that the S&P 500 is testing the bears' second line of defense — the red moving average. The prior strategy of fading rallies at 6,635 and 6,665 remains valid. An alternative short trigger would be the bulls' failure to hold the index above fair value at 6,590.


