
আরও দেখুন


 11.11.2026 06:07 AM
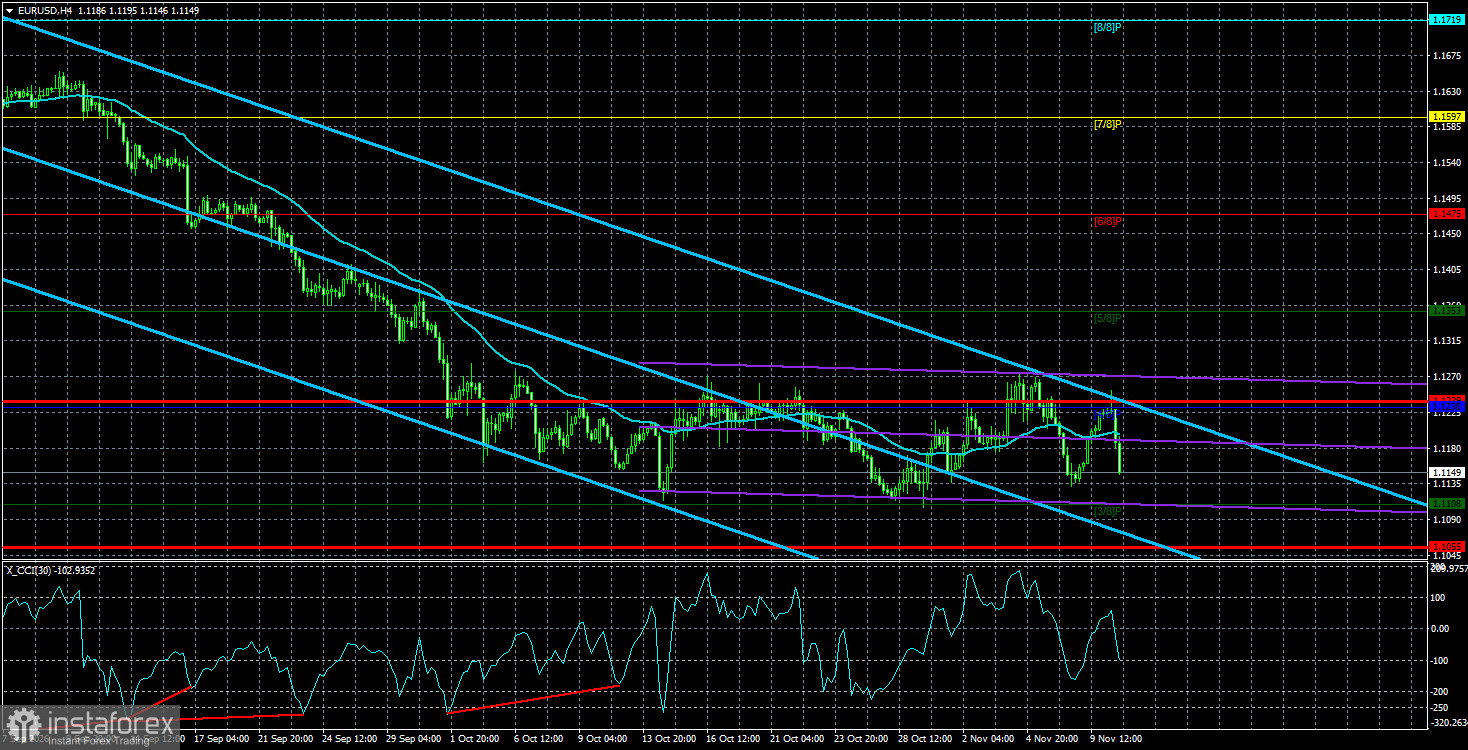
On Tuesday, the EUR/USD pair was entirely focused on the inflation report, which we will discuss further. Overall, the pair remains in a sideways channel that is already "a month old" and shows no sign of ending. Since the market is completely flat, we see no point in searching for events and news that won't influence the pair's movement. For example, many speeches by Federal Reserve, European Central Bank, and Bank of England officials are scheduled this week. But what use are they now if the monetary path of each central bank is known to traders 100%? Central-bank policy depends on inflation, and inflation depends on energy prices. Energy prices depend solely on the situation around the Strait of Hormuz and Kyiv's strikes on Russian refineries. Traders should focus on these events, not yet another speech by another central-bank representative who again says we need to fight high inflation.
If you consider every piece of news and every media message, it is easy to get lost in this "confusion." Traders must learn to separate the wheat from the chaff and focus on important, key events and patterns. Understand that the market is not a lecture in a trading school where everything is easy and simple in words. The market is a living organism whose actions cannot be predicted with 100% probability. For example, over the past three months we have observed an absolutely illogical rise in the US currency. Moreover, the dollar rises only against the euro, while it somehow does not rise against the pound sterling. Naturally, one can attribute this situation to the French budget crisis and mass unrest in EU countries. But recall how many times protests were held in the United States against Trump's policies? The US president even had to mobilize the National Guard last year to suppress protests.
Talking about the 2026 budget crisis is almost laughable. Which country does not have one? Is the US fine with its debts and resources? US government debt has topped $40 trillion, and the federal budget remains in deficit. US bond yields continue to surge, and a bubble has been inflating in the US stock market for several years (if not longer). De-dollarization has been underway globally for more than 10 years, and Donald Trump's policies have alienated America from half the world. On what basis is the dollar so strong in the second half of 2026 if geopolitical deterioration is absent? On the contrary, Iran and the US, as well as Ukraine and Russia, have, for the first time in a long while, shown at least some willingness not to refuse talks but to reach a peace agreement. Of course, talks can be long and difficult, but they offer a chance of success. Easing geopolitical tension is a factor supporting risk currencies—of which the dollar is not one.
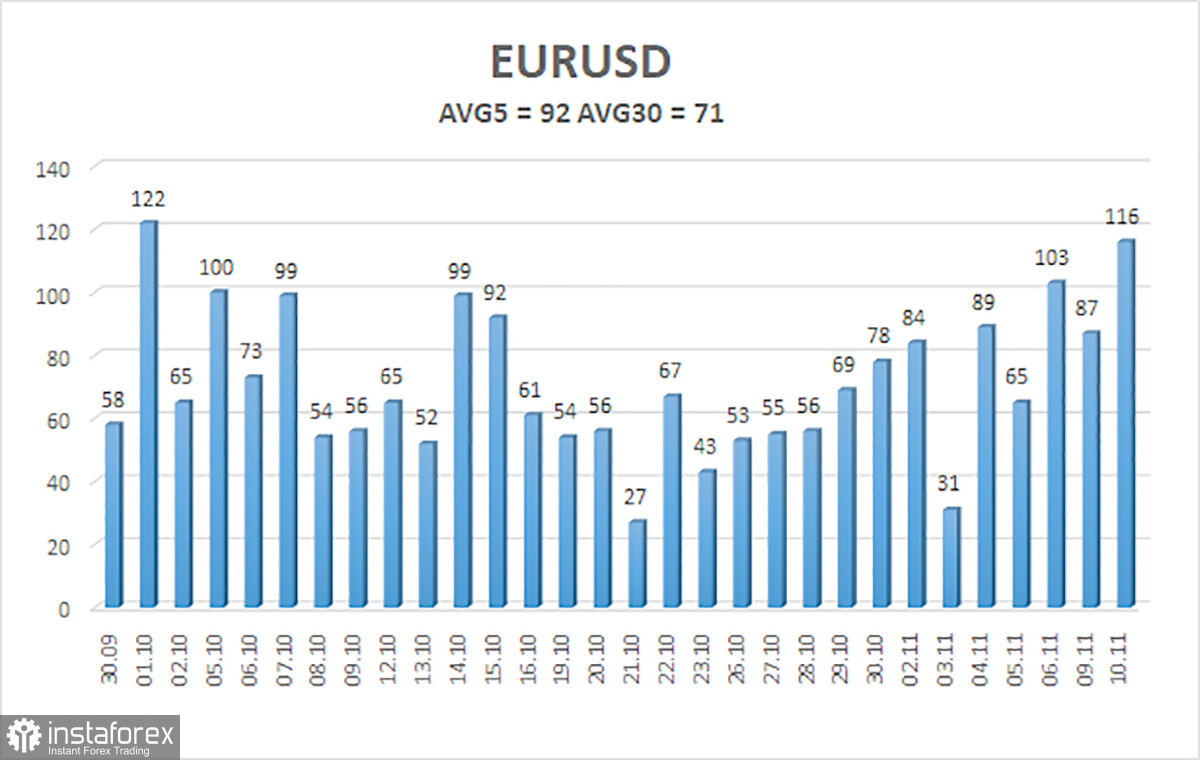
The average volatility of the EUR/USD pair over the last 5 trading days as of November 11 is 92 pips and is characterized as "average." We expect the pair to move between 1.1055 and 1.1228 on Wednesday. The major linear-regression channel is pointing down, indicating a downtrend. The CCI indicator entered the oversold area five times and formed four "bullish" divergences, but traders ignored all of these signals. The illogical downtrend persists.
S1 – 1.1108
S2 – 1.0986
S3 – 1.0864
R1 – 1.1230
R2 – 1.1353
R3 – 1.1475
The EUR/USD pair remains in a downtrend that lacks sufficient fundamental, macroeconomic, or geopolitical support to continue. The global fundamental backdrop for the dollar remains negative, but in 2026, geopolitics and then the Fed's hawkish stance provided strong support for the US currency. When the price is below the moving average, short positions can be considered with targets of 1.1108 and 1.1055. Above the moving average, long positions are relevant with targets of 1.1228 and 1.1353. However, the pair first needs to break out of the sideways channel 1.1114–1.1265.


