

অ্যাকচুয়াল প্যাটার্নস

প্যাটার্ন হলো গ্রাফিক্যাল মডেল, যা মূল্য ওঠানামার ভিত্তিতে চার্টে তৈরি হয়। টেকনিক্যাল বিশ্লেষণের নীতি অনুযায়ী, ইতিহাসের (প্রাইস মুভমেন্ট) পুনরাবৃত্তি ঘটে। অর্থাৎ, পরিস্থিতি যদি একই রকম থাকে তাহলে প্রাইস মুভমেন্টও প্রায় একই রকম হয়। এর ফলে মূল্যের ওঠানামা কেমন হবে তা আগেই থেকেই অনুমান করা যায়।
ইন্সটাফরেক্স এর প্রাসঙ্গিক প্যাটার্নসমূহ সহজেই ব্যবহার করা যায়, যার মাধ্যমে মার্কেটের সর্বশেষ পরিস্থিতি জানা যায় এবং তার উপর ভিত্তি করে সিদ্ধান্ত নেওয়া যায়। আমাদের সেবাগুলো থেকে আপনি যেকোনো পেয়ার এবং টাইমফ্রেমের জন্য সর্বশেষ এবং সবচেয়ে প্রাসঙ্গিক প্যাটার্নগুলো খুঁজে পাবেন।
Double Bottom
was formed on 11.06 at 23:00:24 (UTC+0)
signal strength 5 of 5
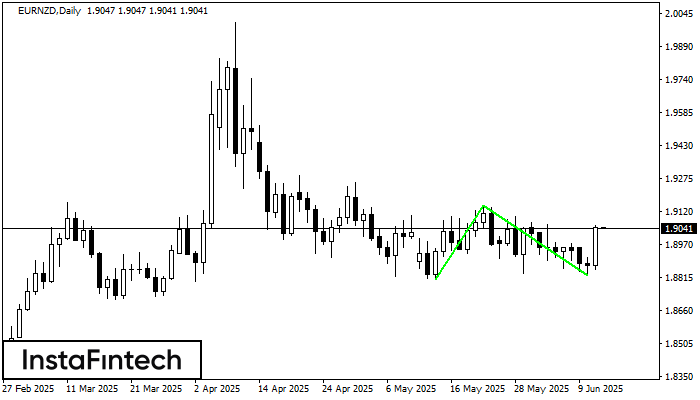
The Double Bottom pattern has been formed on EURNZD D1. Characteristics: the support level 1.8805; the resistance level 1.9150; the width of the pattern 345 points. If the resistance level is broken, a change in the trend can be predicted with the first target point lying at the distance of 328 points.


