
Lihat juga


 07.10.2026 10:45 AM
Less than half. That's the share of S&P 500 stocks trading above their 200-day moving average, and that proportion has been shrinking since August. Yet the broad index and the Nasdaq Composite seem to ignore this and continue to press toward record highs.
Share of S&P 500 companies above the EMA
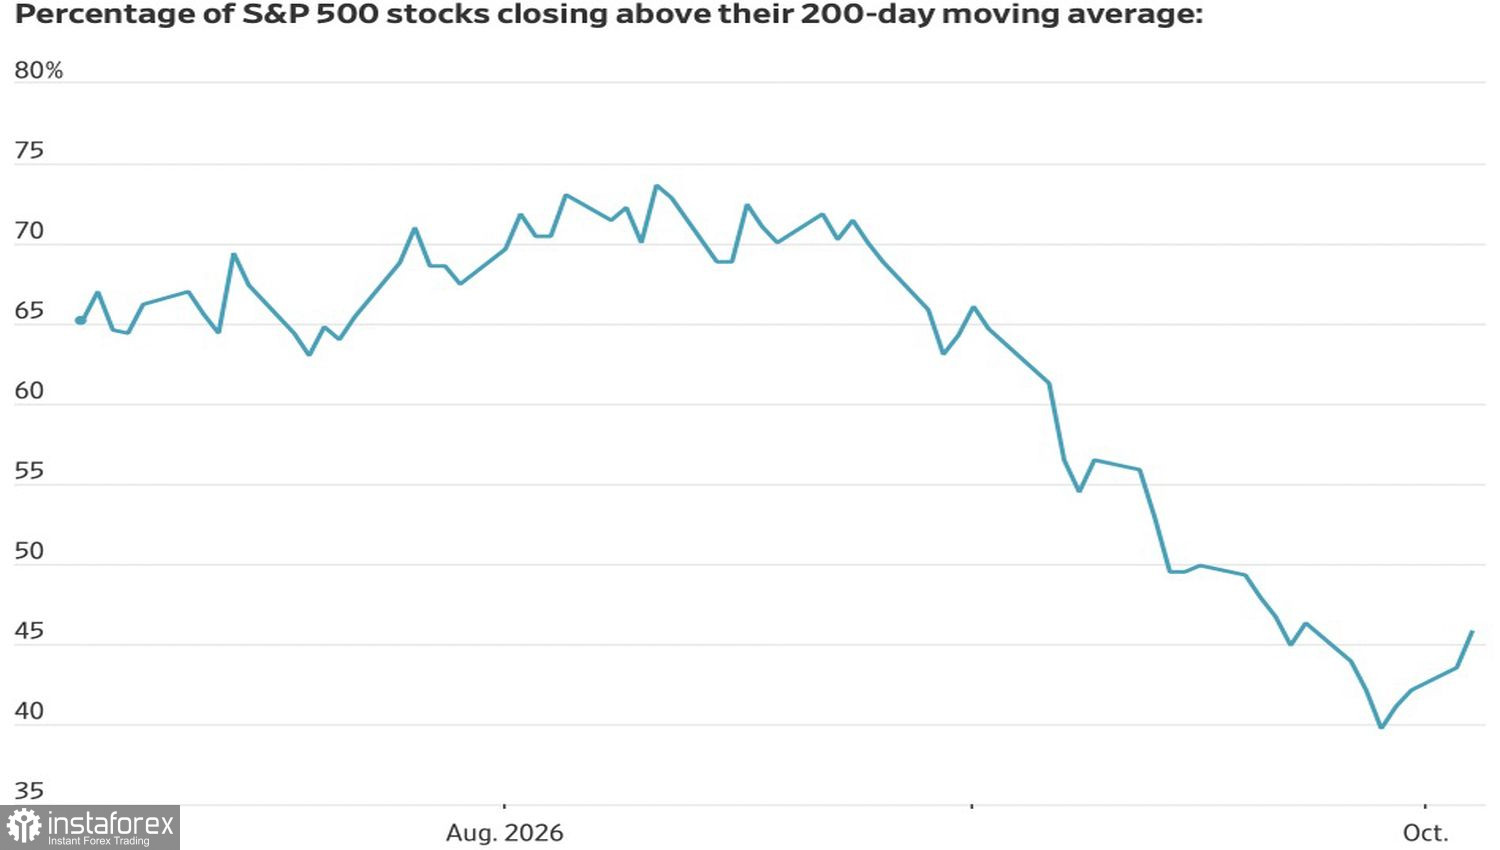
The rally is being supported by mega-cap strength. Nvidia jumped to a fresh record, and Meta Platforms has climbed nearly 25% since mid-August. The rest of the market is stuck in the mud, as if caught in a traffic jam. Stocks in healthcare, banking, consumer sectors, and small-caps are moving lower.
A bullish factor for the S&P 500 is traders' confidence that the tech giants are insulated from higher interest rates. Truist argues that technology is being perceived almost like a defensive asset because investors do not see other sectors that can survive this cycle.
The market is getting a helping hand from the strong balance sheets of the tech giants, even though they are borrowing tens of billions to fund AI development. Potomac Fund Management notes that these balance sheets are propping up the market while rates and inflation squeeze the rest of the S&P 500.
A positive for the market is investor demand for AI leaders. It has pushed the Magnificent Seven's combined market cap to a record $25 trillion and helped the S&P 500 retake its highs for the first time since August, despite a global bond sell-off that drove US Treasury yields to two-decade highs. The advance was broad across most sectors, except healthcare.
Dynamics of S&P 500 and S&P 500 Equal Weighted Index
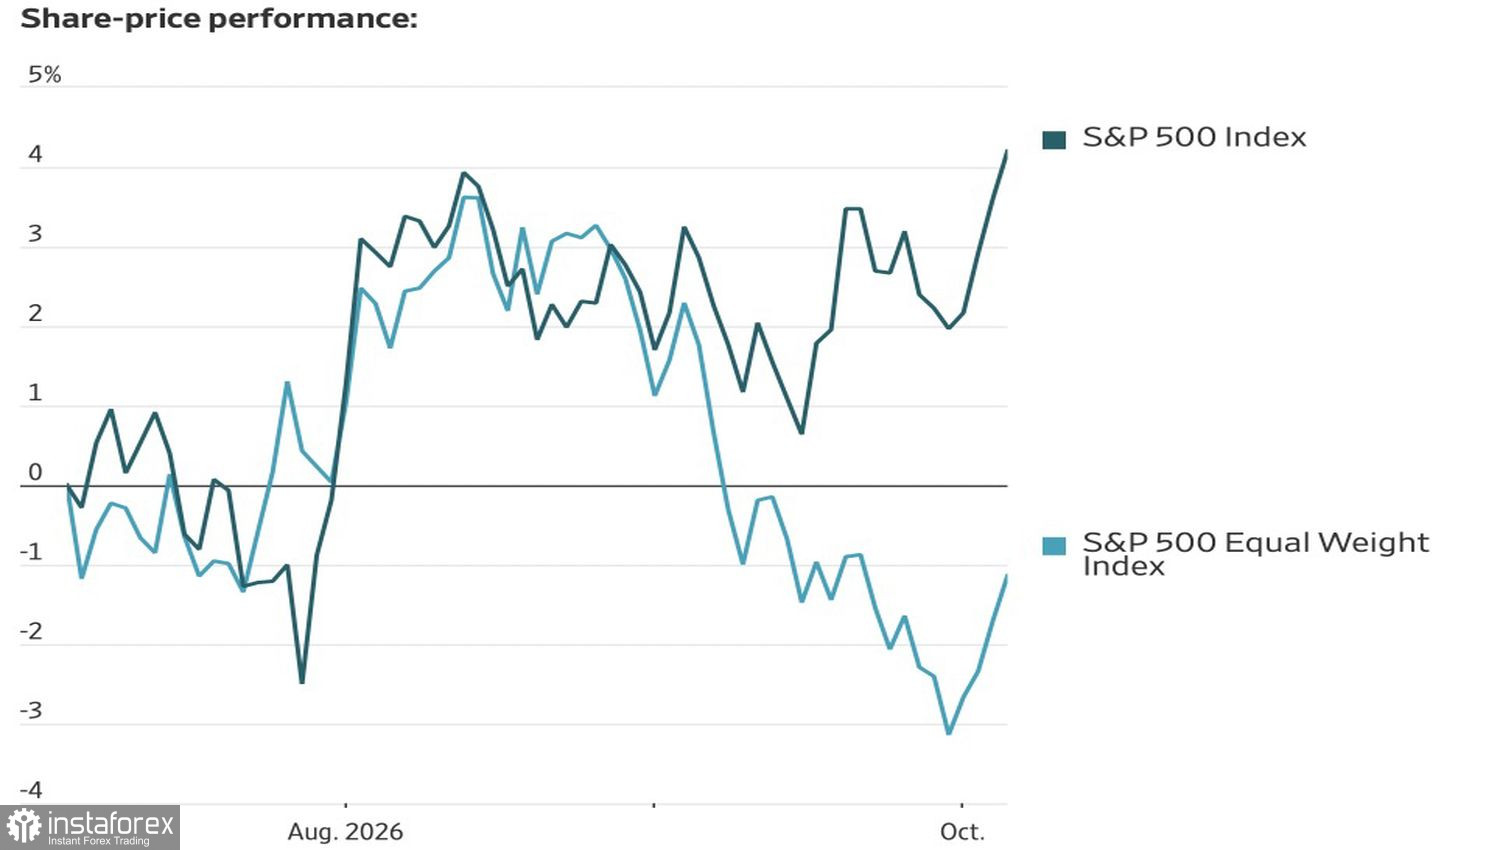
A negative for the S&P 500 rally is narrow market breadth. Bank of America calls low breadth a classic bubble signal — it swells like a soap bubble until it bursts. They recommend using mega-cap derivatives to participate in the rally while hedging against a potential crash.
Paulsen Perspectives warns that the combination of $100 oil, bond yields near 5%, and a strong dollar has historically preceded a 15% drop in the S&P 500 over three to five months. Their proprietary pressure index, weighted half to the 10-year yield and a quarter each to the dollar and oil, was associated with a 20–25% market decline at similar readings. Most sectors have traded sideways for too long, and they expect a 20% pullback for the tech sector.
In short, the market is being supported by solid corporate earnings and AI enthusiasm. The headwinds are the narrowness of the rally and risks building in commodity and debt markets.
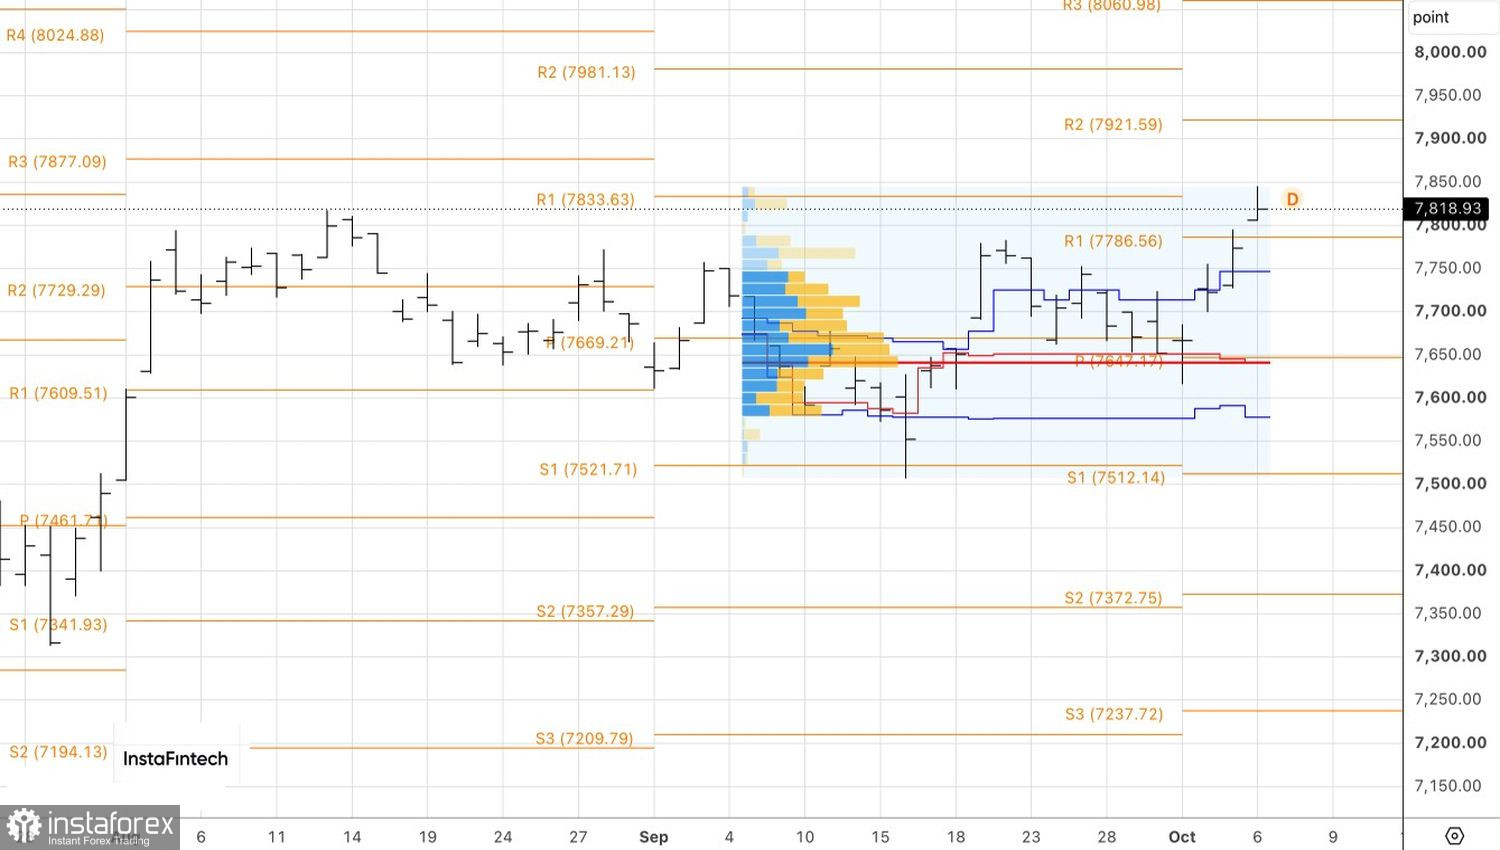
Technically, the daily chart shows that the S&P 500 remains in an uptrend, heading toward 7,920 and 7,980. Buying the dips makes sense.


