empty
09.04.2023 06:02 PM
Technical analysis of GBP/USD for April 09, 2023

This image is no longer relevant

Overview:

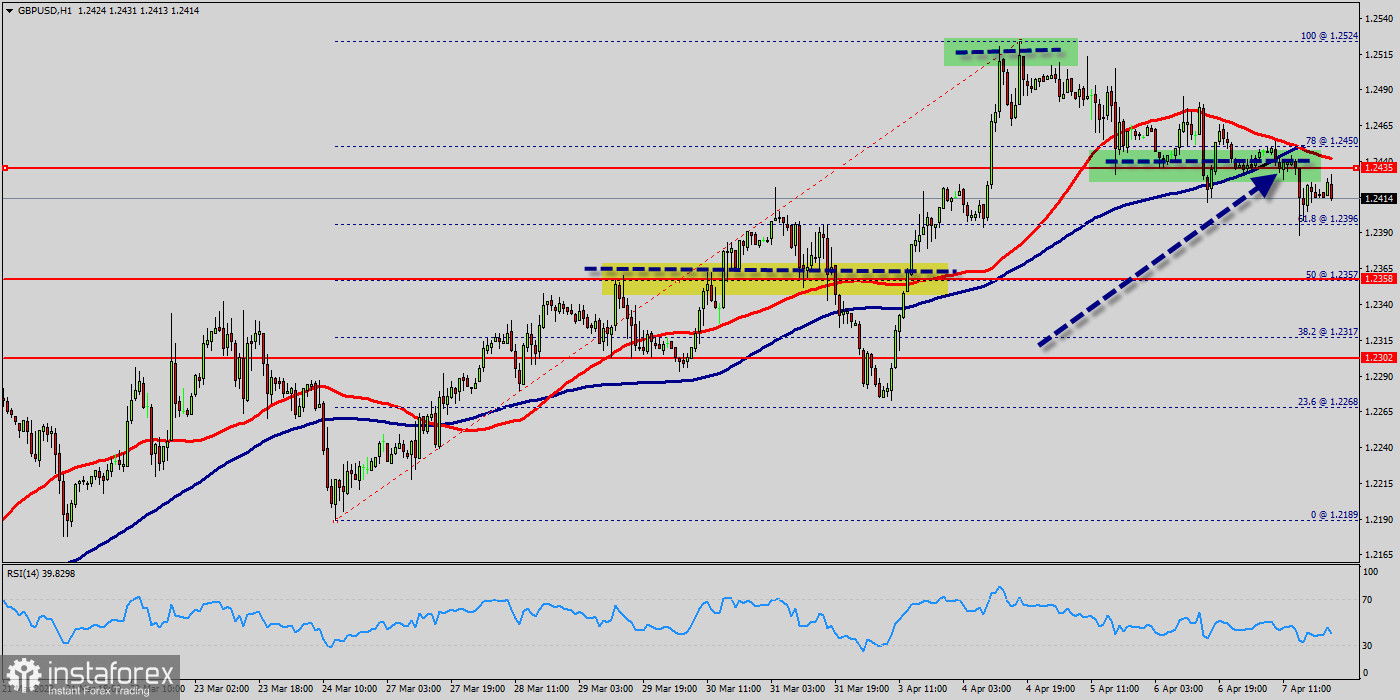
The GBP/USD pair broke resistance which turned to strong support at the level of 1.2302 yesterday. The level of 1.2302 coincides with a golden ratio (38.2% of Fibonacci : 1.2317), which is expected to act as major support today. The Relative Strength Index (RSI) is considered overbought because it is above 30. The RSI is still signaling that the trend is upward as it is still strong above the moving average (100).

This suggests the pair will probably go up in coming hours. This support has been rejected for three times confirming uptrend veracity. Hence, major support is seen at the level of 1.2302 because the trend is still showing strength above it.

The Relative Strength Index (RSI) is considered oversold because it is above 35. At the same time, the RSI is still signaling an upward trend, as the trend is still showing strong above the moving average (100), this suggests the pair will probably go up in coming hours.

Accordingly, the market is likely to show signs of a bullish trend. In other words, buy orders are recommended above 1.2302 with the first target at the level of 1.2358. From this point, the pair is likely to begin an ascending movement to the point of 1.2358 and further to the level of 1.2435.

The level of 1.2435 will act as strong resistance and the double top is already set at the point of 1.2435. On the other hand, if a breakout happens at the support level of 1.2302, then this scenario may become invalidated.

Conclusion :

We should see the pair climbing towards the next target of 1.2435. The pair will move upwards continuing the development of the bullish trend to the level 1.2435 and 1.2500 in coming days.

On the other hand, in case a reversal takes place and the GBP/USD pair breaks through the support level of 1.2302, a further decline to 1.2260 can occur. It would indicate a bearish market.

Recommended Stories

USD/JPY की भविष्यवाणी - 23 जुलाई, 2025

आज सुबह, कीमत 146.29 के समर्थन स्तर तक पहुंची और निर्णायक रूप से ऊपर की ओर मुड़ी। यह देखना बाकी है कि क्या यह दृढ़ता 148.66 को तोड़ने के लिए

Laurie Bailey 07:20 2025-07-23 UTC+2

GBP/USD – 22 जुलाई: पाउंड ने मंदी का रुख तोड़ा

प्रति घंटा चार्ट पर, GBP/USD जोड़ी ने सोमवार को पाउंड के पक्ष में एक नया उलटफेर किया और 76.4% फिबोनाची स्तर से ऊपर 1.3470 पर समेकित हुई, जिससे पिछले दो

Samir Klishi 19:19 2025-07-22 UTC+2

22-25 जुलाई, 2025 के लिए BITCOIN ट्रेडिंग सिग्नल: $115,625 से ऊपर खरीदारी करें (/8 Murray - 21 SMA)।

बिटकॉइन लगभग $117,522 के स्तर पर ट्रेड कर रहा है, जो $116,070 के निचले स्तर से वापस उछला है। कल, यूरोपियन सेशन के दौरान, बिटकॉइन ने $119,500 का उच्च स्तर

Dimitrios Zappas 09:16 2025-07-22 UTC+2

GBP/USD में अपनी सबसे नजदीकी रेसिस्टेंस स्तरों की ओर मजबूती आने की संभावना है, मंगलवार, 22 जुलाई 2025 को।

GBP/USD – मंगलवार, 22 जुलाई, 2025 GBP/USD बुलिश स्थिति में बना हुआ है, हालांकि नीचे की ओर सुधार संभव है। फिर भी, जब तक अस्थायी कमजोरी अपने सपोर्ट 2 स्तर

Arief Makmur 09:10 2025-07-22 UTC+2

USD/JPY अपने पिवट स्तर का परीक्षण करने का प्रयास करेगा, लेकिन जब तक 148.32 मजबूत बना रहता है, यह मंगलवार, 22 जुलाई 2025 को अपनी गिरावट जारी रखेगा।

USD/JPY – मंगलवार, 22 जुलाई, 2025 USD/JPY का झुकाव मंदी (बेयरिश) की स्थिति में बना हुआ है, लेकिन जब तक पिवट और रेसिस्टेंस लेवल 1 अस्थायी रैली को थाम सकता

Arief Makmur 09:07 2025-07-22 UTC+2

EUR/USD. विश्लेषण और पूर्वानुमान

नए सप्ताह की शुरुआत में, EUR/USD जोड़ी एक मध्यम दायरे में बनी हुई है और एक संकीर्ण चैनल में कारोबार कर रही है। वर्तमान में, भाव 1.1650 के स्तर के

Irina Yanina 19:05 2025-07-21 UTC+2

21 जुलाई, 2025 को GBP/USD का पूर्वानुमान

प्रति घंटा चार्ट पर, शुक्रवार को GBP/USD जोड़ी 76.4% फिबोनाची रिट्रेसमेंट स्तर 1.3470 से उछलकर अमेरिकी डॉलर के पक्ष में पलट गई और थोड़ा पीछे हट गई। 1.3470 से दो

Samir Klishi 15:26 2025-07-21 UTC+2

यदि Kiwi अपने पिवट स्तर से ऊपर तोड़ने में सफल रहता है, तो Kiwi में आज, सोमवार, 21 जुलाई 2025 को मजबूत होने की संभावना है।

हालांकि तकनीकी रूप से सभी संकेतक अभी भी कमजोरी की ओर इशारा करते हैं, लेकिन कीमत की चाल और RSI(14) संकेतक के बीच डाइवर्जेंस का उभरना आज NZD/USD मुद्रा युग्म

Arief Makmur 12:14 2025-07-21 UTC+2

EUR/USD में आज, सोमवार, 21 जुलाई 2025 को अपने निकटतम प्रतिरोध स्तर की ओर मजबूत होने की संभावना है।

हालांकि 50-दिवसीय मूविंग एवरेज (EMA) अभी भी 200-दिवसीय मूविंग एवरेज (EMA) से नीचे है, जो एक बेयरिश न्यूट्रल स्थिति को दर्शाता है, और RSI (14) भी बेयरिश न्यूट्रल स्तर

Arief Makmur 11:49 2025-07-21 UTC+2

यदि XAU/USD सफलतापूर्वक पिवट स्तर को तोड़कर उसके नीचे बंद होता है, तो इसमें अगले समर्थन स्तर तक गिरावट जारी रखने की संभावना है, फ्राइडा।y, July 18, 2025.

XAU/USD – शुक्रवार, 18 जुलाई, 2025। XAU/USD के कमजोर होने की संभावना जारी है, जैसा कि EMA (50) का EMA (200) के नीचे होना और RSI (14) का बीयरिश न्यूट्रल

Arief Makmur 08:49 2025-07-18 UTC+2
अभी बात नहीं कर सकते?
अपना प्रश्न पूछें बातचीत.
 

Dear visitor,

Your IP address shows that you are currently located in the USA. If you are a resident of the United States, you are prohibited from using the services of InstaFintech Group including online trading, online transfers, deposit/withdrawal of funds, etc.

If you think you are seeing this message by mistake and your location is not the US, kindly proceed to the website. Otherwise, you must leave the website in order to comply with government restrictions.

Why does your IP address show your location as the USA?

  • - you are using a VPN provided by a hosting company based in the United States;
  • - your IP does not have proper WHOIS records;
  • - an error occurred in the WHOIS geolocation database.

Please confirm whether you are a US resident or not by clicking the relevant button below. If you choose the wrong option, being a US resident, you will not be able to open an account with InstaTrade anyway.

We are sorry for any inconvenience caused by this message.