empty
24.08.2023 03:57 PM
USDCAD vulnerable to a reversal.

This image is no longer relevant

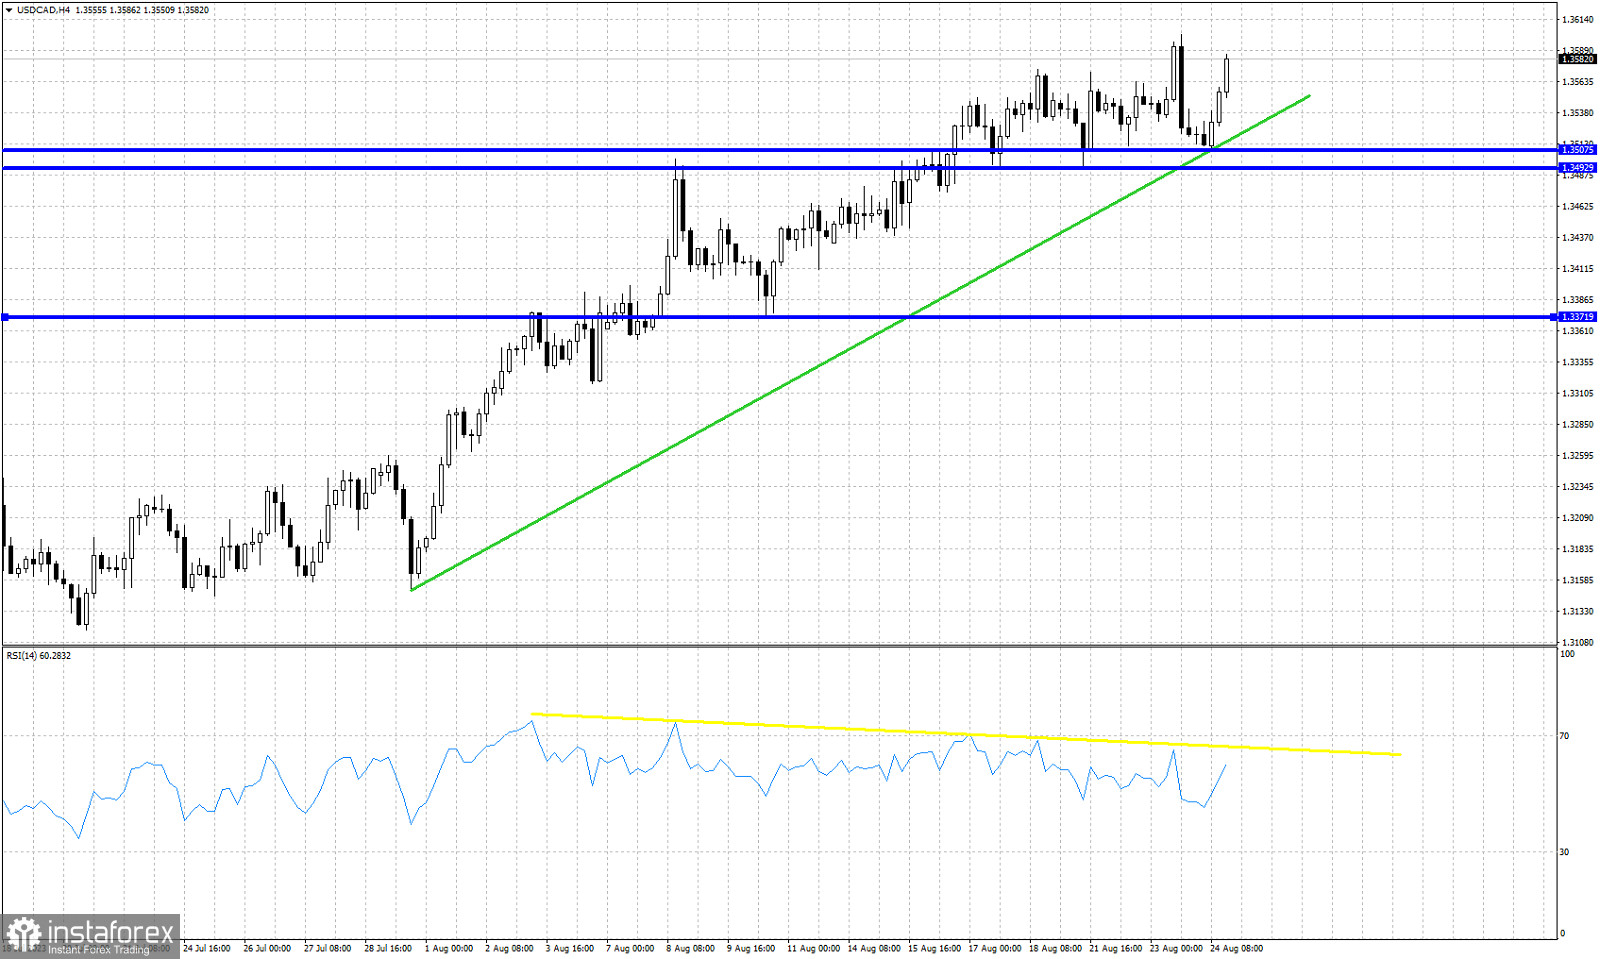
Blue lines- higher lows

green line- support trend line

Yellow line- bearish RSI divergence

USDCAD is trading around 1.3573 still making higher highs and higher lows. Recent pull back towards 1.3508 almost gave us a bearish reversal signal, but price did not form a lower low. Instead price formed a new higher low and is now bouncing higher with potential to reach 1.36.Support by the trend line is found at 1.3520. Technically trend remains bullish. However the bearish RSI divergence we see for the last few trading sessions suggest that the up trend is weakening and a reversal could start any time soon. That is why we believe that the upside potential is limited and traders should protect their profits, as there are increased chances of a reversal. At current levels I prefer to be neutral USDCAD if not bearish. A break below 1.3508 will confirm a trend reversal.

Recommended Stories

कच्चे तेल कमोडिटी उपकरण की इंट्राडे मूल्य गति का तकनीकी विश्लेषण, सोमवार, 16 जून, 2025।

कच्चे तेल कमोडिटी उपकरण के 4-घंटे के चार्ट पर, #CL कीमत की चाल और Stochastic Oscillator संकेतक के बीच डाइवर्जेंस दिखाई दे रहा है, जो संकेत देता है कि निकट

Arief Makmur 07:43 2025-06-16 UTC+2

यूएसडी/आईडीआर विदेशी मुद्रा जोड़े के दैनिक मूल्य गति का तकनीकी विश्लेषण, सोमवार, 16 जून, 2025।

इस विदेशी मुद्रा जोड़े की कमजोर होती स्थिति के बीच बुलिश 123 पैटर्न के प्रकट होने के साथ, जिसे USD/IDR की कीमत की चाल द्वारा पुष्टि मिली है, जो

Arief Makmur 07:42 2025-06-16 UTC+2

नास्डैक 100 सूचकांक के इंट्राडे मूल्य आंदोलन का तकनीकी विश्लेषण, गुरुवार 12 जून, 2025।

नास्डैक 100 सूचकांक के 4-घंटे के चार्ट पर, इसकी कीमत की चाल और स्टोकेस्टिक ऑस्सीलेटर संकेतक के बीच विसंगति है, खासकर तब जब वर्तमान में #NDX की कीमत EMA (21)

Arief Makmur 14:03 2025-06-12 UTC+2

क्रूड ऑयल कमोडिटी इंस्ट्रूमेंट की दैनिक मूल्य चाल का तकनीकी विश्लेषण, गुरुवार 12 जून, 2025।

अगर हम क्रूड ऑयल कमोडिटी इंस्ट्रूमेंट के दैनिक चार्ट को देखें, तो #CL की मूल्य चाल और स्टोकास्टिक ऑस्सीलेटर इंडिकेटर के बीच एक विचलन दिखाई देता है, जो इस बात

Arief Makmur 13:57 2025-06-12 UTC+2

गोल्ड (XAU/USD) के लिए 11-14 जून 2025 के ट्रेडिंग सिग्नल: $3,340 (21 SMA - 7/8 मरे) के नीचे बेचें।

अगर सोना डाउनट्रेंड चैनल को तोड़कर 3,340 के ऊपर स्थिर होता है, तो इसका परिदृश्य बुलिश हो सकता है। इस स्थिति में धातु 3,359, 3,390 और यहां तक कि मरे

Dimitrios Zappas 08:09 2025-06-11 UTC+2

BITCOIN (BTC/USD) के लिए 11 से 13 जून तक ट्रेडिंग सिग्नल: $110,700 (21 SMA - 200 EMA) के नीचे बेचें।

बिटकॉइन वर्तमान में लगभग 110,726 के आसपास ट्रेड कर रहा है, और मई के अंत में देखे गए स्तर 110,726 तक पहुंचने के बाद तकनीकी सुधार की प्रक्रिया में है।

Dimitrios Zappas 08:03 2025-06-11 UTC+2

GBP/JPY क्रॉस करेंसी पेयर्स के इंट्राडे प्राइस मूवमेंट का तकनीकी विश्लेषण, मंगलवार 10 जून, 2025।

GBP/JPY क्रॉस करेंसी पेयर के 4-घंटे के चार्ट पर कई दिलचस्प बातें देखी जा सकती हैं। पहली बात यह है कि प्राइस मूवमेंट WMA (21) के ऊपर चल रहा है

Arief Makmur 07:57 2025-06-10 UTC+2

EUR/USD मुख्य मुद्रा जोड़ी की इंट्राडे कीमत गति का तकनीकी विश्लेषण, मंगलवार 10 जून 2025।

Ascending Broadening Wedge पैटर्न के प्रकट होने के बाद Bearish 123 पैटर्न के दिखने से यह संकेत मिलता है कि निकट भविष्य में EUR/USD कमजोर हो सकता है, खासकर

Arief Makmur 07:55 2025-06-10 UTC+2

EUR/USD पूर्वानुमान – 9 जून, 2025 के लिए

मध्यम रूप से आशावादी अमेरिकी रोज़गार डेटा ने डॉलर को पुनर्जीवित किया, जिससे इसमें 0.44% की बढ़त हुई। यूरो 50 पिप्स गिर गया। स्टॉक मार्केट के साथ एक विचलन (डाइवर्जेंस)

Laurie Bailey 12:09 2025-06-09 UTC+2

USD/JPY का पूर्वानुमान, 9 जून 2025

पिछले येन विश्लेषण में हमने उल्लेख किया था कि 145.08 स्तर मुख्य लक्ष्य 146.11 के लिए एक मध्यवर्ती बाधा के रूप में काम करता है। हालांकि, आज सुबह तक, बुल्स

Laurie Bailey 07:36 2025-06-09 UTC+2
अभी बात नहीं कर सकते?
अपना प्रश्न पूछें बातचीत.
 

Dear visitor,

Your IP address shows that you are currently located in the USA. If you are a resident of the United States, you are prohibited from using the services of InstaFintech Group including online trading, online transfers, deposit/withdrawal of funds, etc.

If you think you are seeing this message by mistake and your location is not the US, kindly proceed to the website. Otherwise, you must leave the website in order to comply with government restrictions.

Why does your IP address show your location as the USA?

  • - you are using a VPN provided by a hosting company based in the United States;
  • - your IP does not have proper WHOIS records;
  • - an error occurred in the WHOIS geolocation database.

Please confirm whether you are a US resident or not by clicking the relevant button below. If you choose the wrong option, being a US resident, you will not be able to open an account with InstaTrade anyway.

We are sorry for any inconvenience caused by this message.