यह भी देखें

 17.03.2023 09:13 AM
Trend analysis (fig. 1).
The pair may climb to 1.2199, the Fibonacci retracement level of 61.8% (blue dotted line) from 1.2108, the closing of yesterday's daily candlestick. After reaching this level, it is likely to retreat to 1.2140, the Fibonacci retracement level of 14.6% (yellow dotted line).
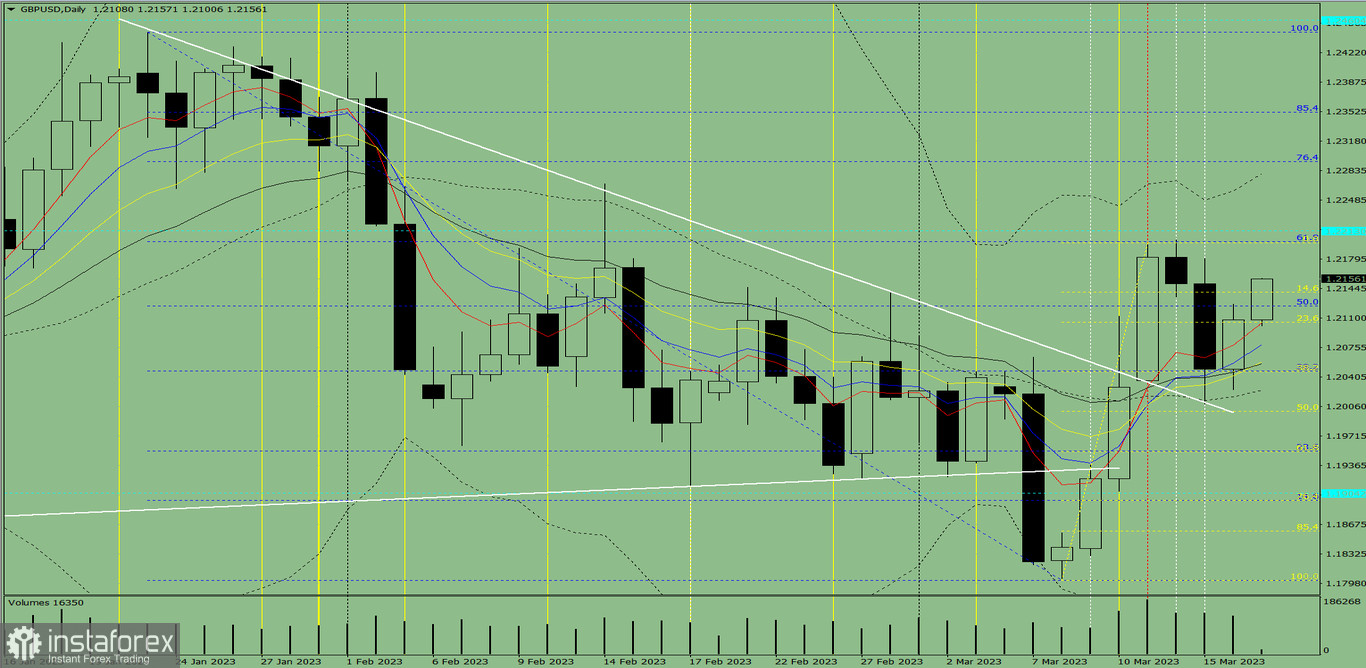
Fig. 1 (intraday chart).
Complex analysis:
- indicator analysis– up;
- Fibonacci levels – up;
- trading volumes – up;
- candlestick analysis – up;
- trend analysis – up;
- Bollinger lines – up;
- weekly chart - up.
Conclusion:
The pair may climb to 1.2199, the Fibonacci retracement level of 61.8% (blue dotted line) from 1.2108, the closing of yesterday's daily candlestick. After reaching this level, it is likely to retreat to 1.2140, the Fibonacci retracement level of 14.6% (yellow dotted line).
Alternatively, the price may move to 1.2199, the Fibonacci retracement level of 61.8% (blue dotted line) from 1.2108, the closing of yesterday's daily candlestick. After hitting this level, the price may rise higher.
You have already liked this post today
*यहां पर लिखा गया बाजार विश्लेषण आपकी जागरूकता बढ़ाने के लिए किया है, लेकिन व्यापार करने के लिए निर्देश देने के लिए नहीं |

