यह भी देखें

 11.12.2023 06:00 AM
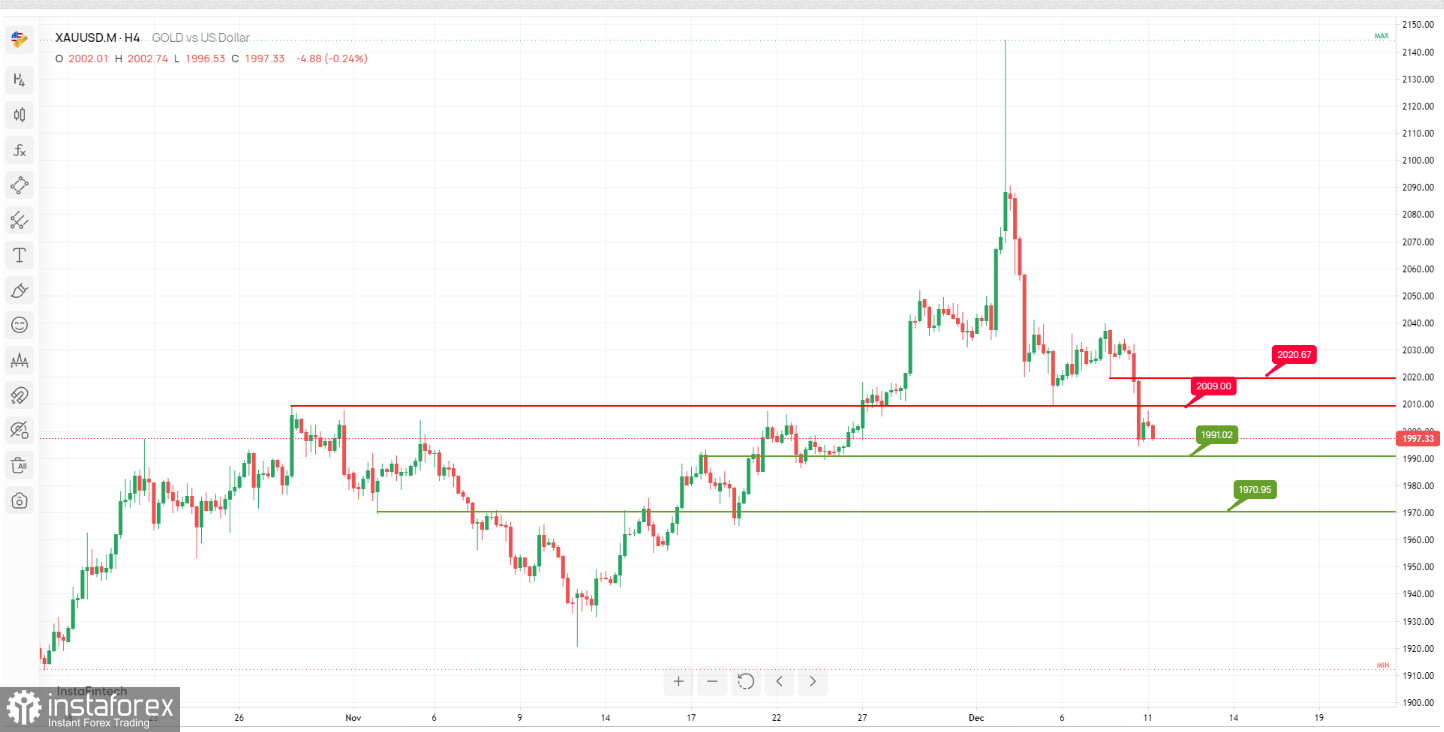
The XAU/USD chart suggests the potential for a bullish bounce, with significant support and resistance levels influencing its possible price movements.
Support Levels:
At the 1st support level of 191.02, we find "An Overlap support." This level indicates a zone where buying interest may emerge, potentially acting as a strong support zone. Furthermore, the 2nd support level at 1970.95 is characterized by "An Overlap support," further reinforcing its role as a substantial support zone.
Resistance Levels:
On the resistance side, the 1st resistance level at 2009.00 is identified as "Pullback resistance." This level implies a zone where selling pressure may surface, potentially hindering further upward momentum. Additionally, the 2nd resistance level at 2020.67 is marked by "Pullback resistance," emphasizing its significance as a resistance zone.
You have already liked this post today
*यहां पर लिखा गया बाजार विश्लेषण आपकी जागरूकता बढ़ाने के लिए किया है, लेकिन व्यापार करने के लिए निर्देश देने के लिए नहीं |

