यह भी देखें

 23.02.2026 12:38 PM
GBP/USD
Analysis:
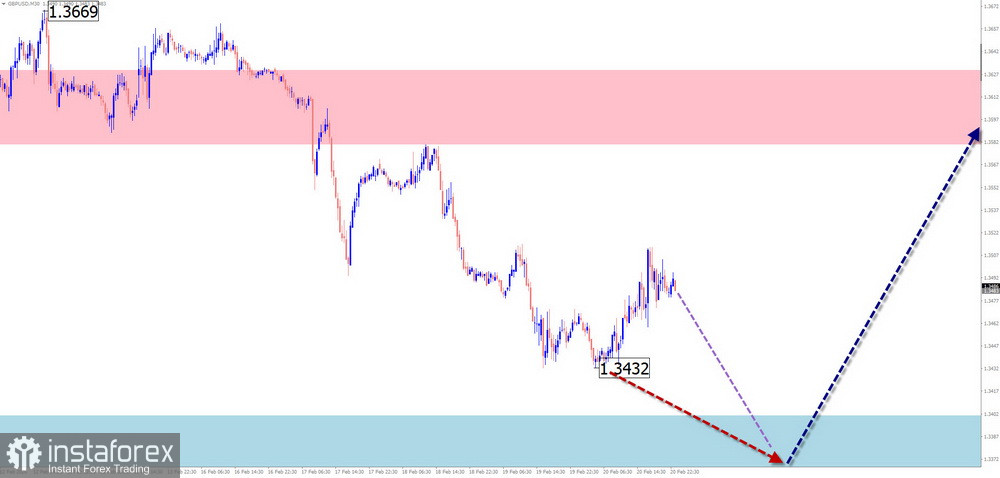
On the British pound chart, the short-term trend since the end of January this year has been driven by a downward wave with reversal potential. Its middle segment (B) is currently developing and remains unfinished at the time of analysis. The price is approaching the upper boundary of a strong potential reversal zone.
Forecast:
At the beginning of the coming week, continued bearish sentiment is expected, with price declining toward the support zone. A sideways flat reversal may then form. A change in direction and the beginning of price growth are expected by the end of the week.
Potential Reversal Zones
Resistance:
Support:
Recommendations:
AUD/USD
Analysis:
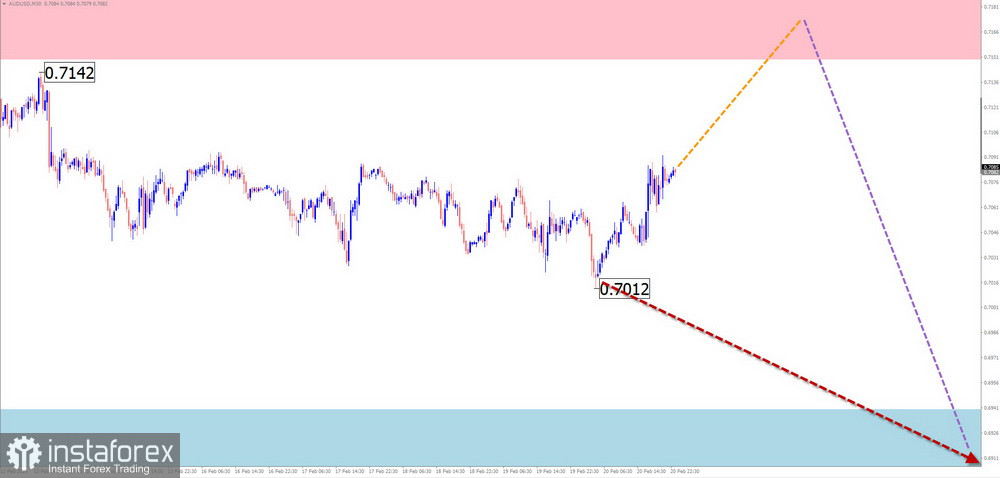
The current wave structure of the Australian dollar chart, active since April last year, is directed upward. Since the end of January, quotes have been corrected. At the time of analysis, the structure resembles a running flat and remains unfinished. The price is moving within a corridor between opposing levels inside a large time frame potential reversal zone.
Forecast:
During the first days of the coming week, there is a high probability of continued growth toward the resistance zone. A brief breakout above its upper boundary cannot be ruled out. Closer to the weekend, the likelihood of a renewed reversal and downward movement toward support increases.
Potential Reversal Zones
Resistance:
Support:
Recommendations:
USD/CHF
Analysis:
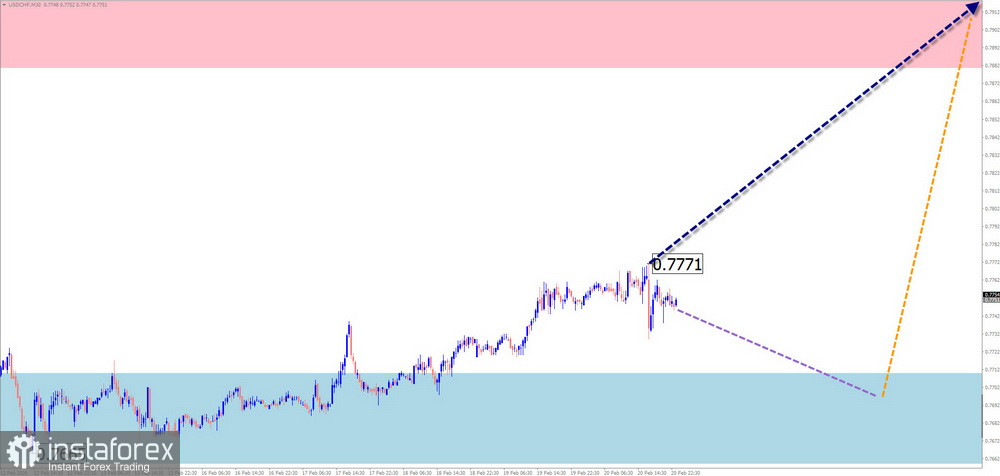
Since April of this year, price movement of the Swiss franc major pair has been driven by an upward running flat algorithm. Since January 27, the beginning of the final segment (C) has been forming within the wave structure. The price is within a wide potential reversal zone on the daily time frame.
Forecast:
In the first half of the week, sideways movement with a downward bias is expected. A pause and formation of a reversal are likely near calculated support. A renewed upward move is expected closer to the weekend.
Potential Reversal Zones
Resistance:
Support:
Recommendations:
EUR/JPY
Analysis:
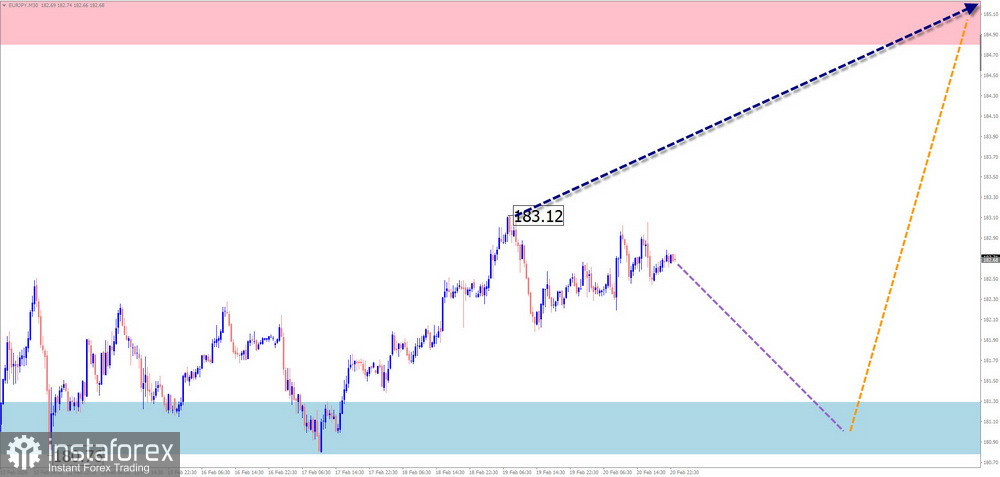
Since February last year, the trend of the euro/yen cross has been determined by an upward wave algorithm. Since October, a running corrective flat has been forming within the wave structure. At the time of analysis, the structure shows the formation of the final segment (C).
Forecast:
In the first days of the coming week, continued bearish sentiment is expected. Pressure on the lower boundary of the support zone cannot be ruled out. A renewed upward movement of the cross is expected in the second half of the week. The upper boundary of the projected weekly movement is defined by calculated resistance.
Potential Reversal Zones
Resistance:
Support:
Recommendations:
Ethereum
Analysis:
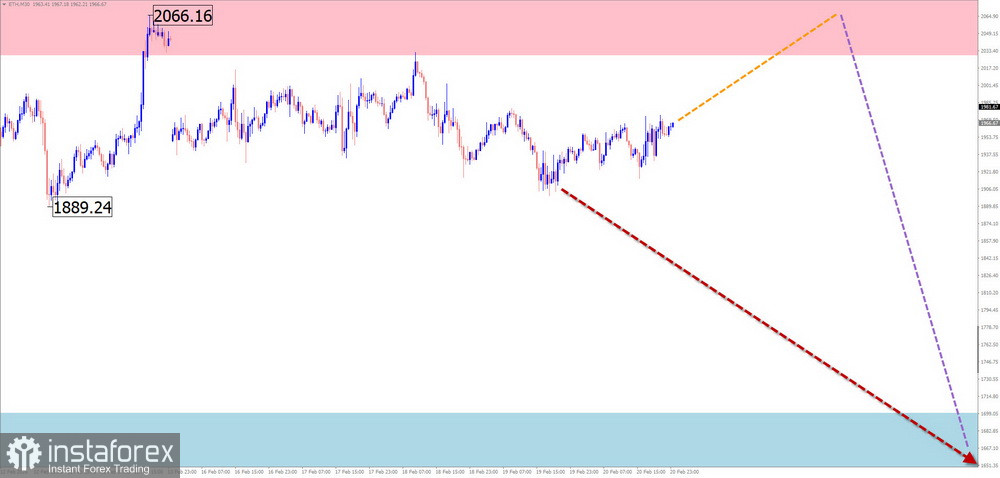
Over the past six months, Ethereum quotes have formed a downward wave on the chart. Since November, within the final segment (C), a corrective pullback has been developing and remains unfinished at the time of analysis. The instrument's quotes are approaching the upper boundary of a large-scale potential reversal zone.
Forecast:
In the coming days, continued sideways movement is expected. Pressure on the upper boundary of the resistance zone is possible. Later, within the flat, a reversal may form. A renewed price decline is more likely closer to the weekend.
Potential Reversal Zones
Resistance:
Support:
Recommendations:
Litecoin
Brief Analysis:
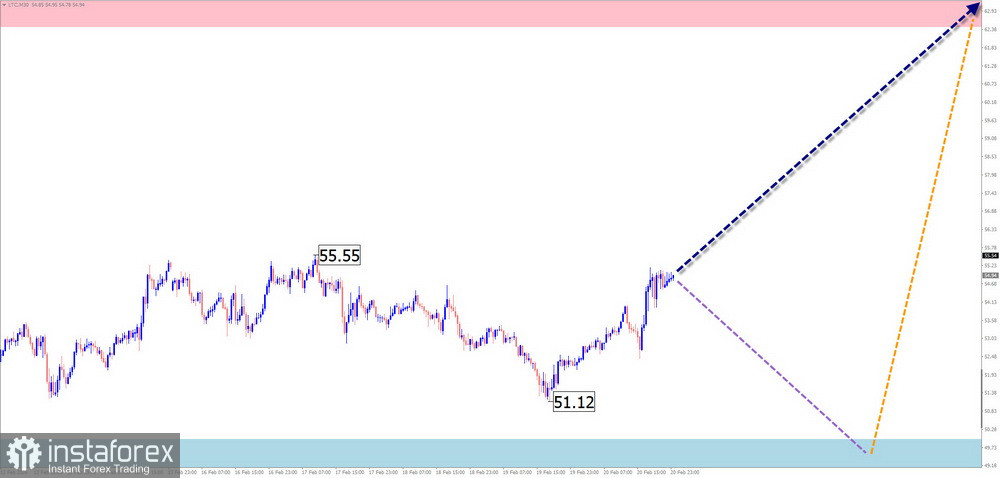
Since October last year, short-term price fluctuations of Litecoin have been driven by an unfinished downward wave algorithm. At the time of analysis, the price has reached the upper boundary of a wide large time frame potential reversal zone. There are no signs of an imminent reversal on the chart.
Weekly Forecast:
This week, overall sideways price movement within the calculated opposing zones is expected. In the first days, a bearish vector is more likely. A reversal may form near calculated support. Growth of the instrument is most likely toward the end of this week or the beginning of next week.
Potential Reversal Zones
Resistance:
Support:
Recommendations:
Notes: In simplified wave analysis (SWA), all waves consist of three parts (A–B–C). In each time frame, the most recent unfinished wave is analyzed. Dotted lines indicate expected movements.
Attention: The wave algorithm does not account for the duration of price movements over time.

