यह भी देखें

 25.02.2026 07:07 AM
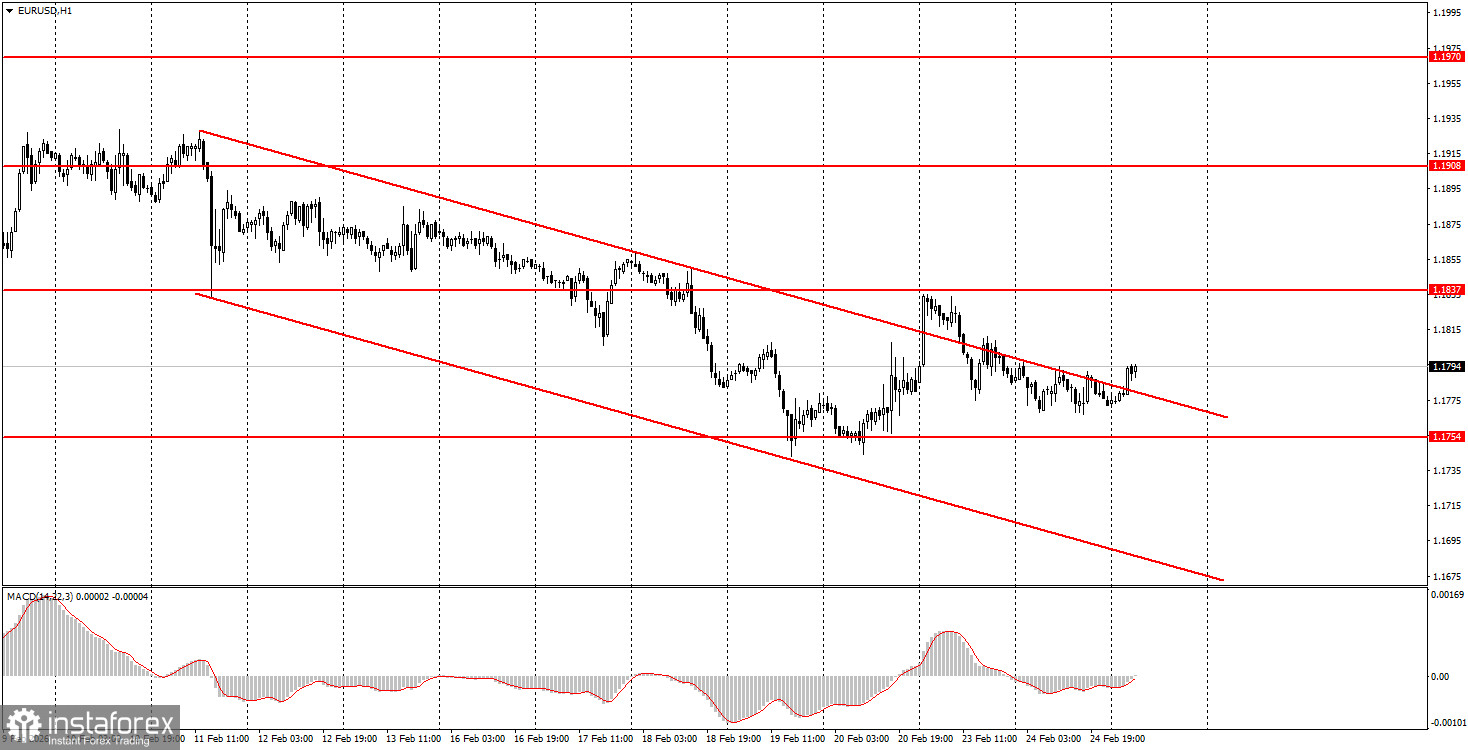
On Tuesday, the EUR/USD currency pair showed no notable movements, and the day's overall volatility was only 30 pips. Thus, there is not much to analyze. There were no significant events or major reports in either the Eurozone or the U.S. throughout the day, and the market quickly moved past the new trade tariffs imposed by Donald Trump. In essence, not much has changed in the global trading architecture since last Friday. Tariffs continue to apply to practically all countries, with the only difference being that there is now a uniform tariff rate of 15% for everyone. Therefore, some have gained, while others have lost from the U.S. Supreme Court's decision. However, the decision itself did not change anything. In our view, there were few reasons for the dollar to rise even in the last two weeks, and now there are even fewer. The market is likely caught up in the potential escalation of the geopolitical conflict in the Middle East, which has supported the American currency. But traders cannot rely on this factor indefinitely.
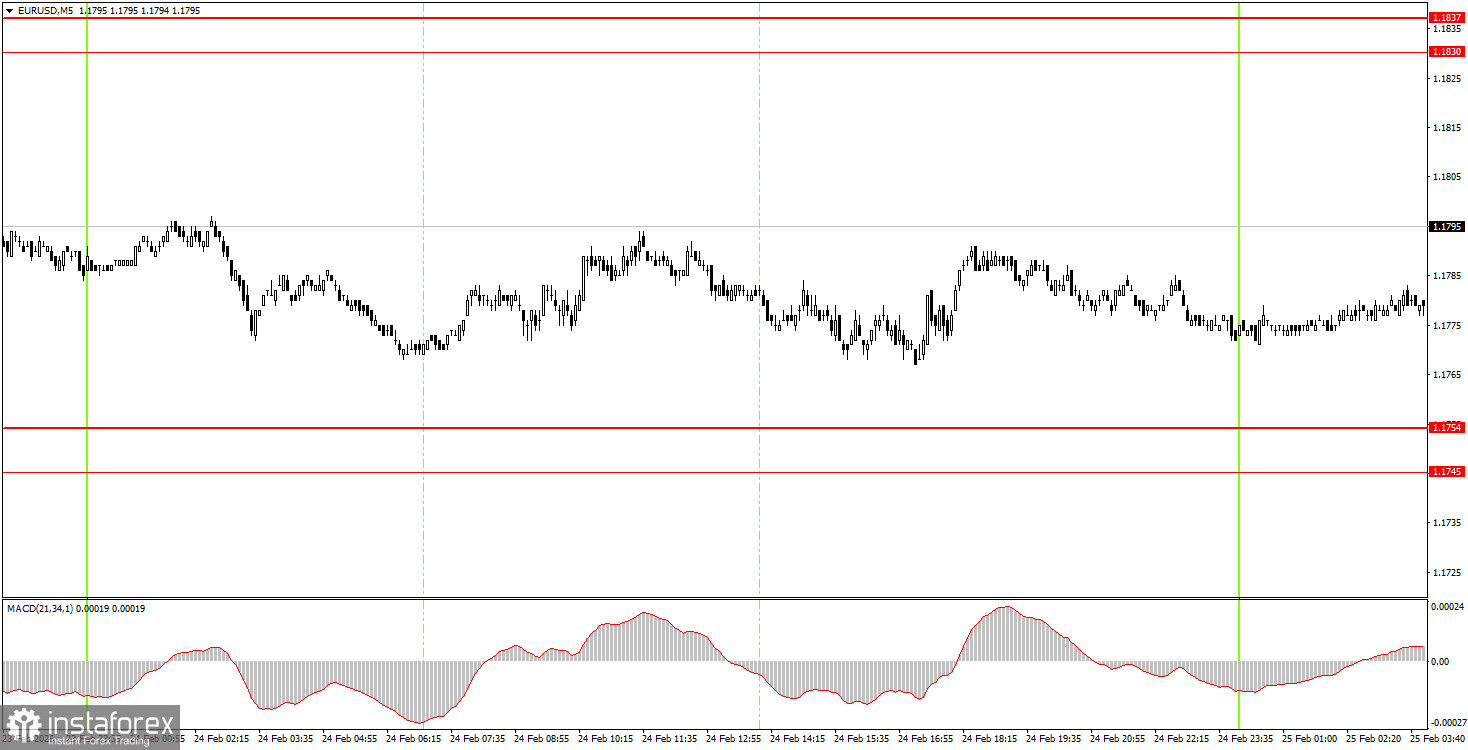
On the 5-minute timeframe, no trading signals were formed on Tuesday. Therefore, throughout the day, beginner traders had no grounds to open any positions. On the hourly timeframe, the pair has exited the descending channel for the second time, so there is still hope for a shift in trend towards the upside.
On the hourly timeframe, the downward correction has been canceled, as the price has consolidated above the descending channel, but the pair is still not showing any growth. At the beginning of 2026, the long-term upward trend has resumed, so we expect new growth for the euro. The overall fundamental background remains very challenging for the American currency, so we fully support further upward movement.
On Wednesday, beginner traders may consider short positions in case of a bounce from the 1.1830-1.1837 area, targeting 1.1745-1.1754. A price consolidation above the 1.1830-1.1837 area will allow opening long positions with a target of 1.1899-1.1908.
On the 5-minute timeframe, levels to consider are 1.1455-1.1474, 1.1527-1.1531, 1.1550, 1.1584-1.1591, 1.1655-1.1666, 1.1745-1.1754, 1.1830-1.1837, 1.1899-1.1908, 1.1970-1.1988, 1.2044-1.2056, 1.2092-1.2104. On Wednesday, several less significant reports will be published in the Eurozone, including the third estimate of fourth-quarter GDP in Germany, the second estimate of January inflation, and the consumer confidence index in Germany. All three reports have a very low chance of provoking significant movements.

