यह भी देखें

 03.03.2026 10:47 AM
During Monday's trading session, the EUR/USD pair rebounded from the 50.0% corrective level at 1.1830, reversed in favor of the dollar, and consolidated below the Fibonacci levels of 1.1770 and 1.1696. As a result, the decline in quotes may continue today toward the next Fibonacci level of 100.0% at 1.1577. A consolidation above 1.1696 would favor the euro and allow for some recovery toward the 61.8% corrective level at 1.1770.
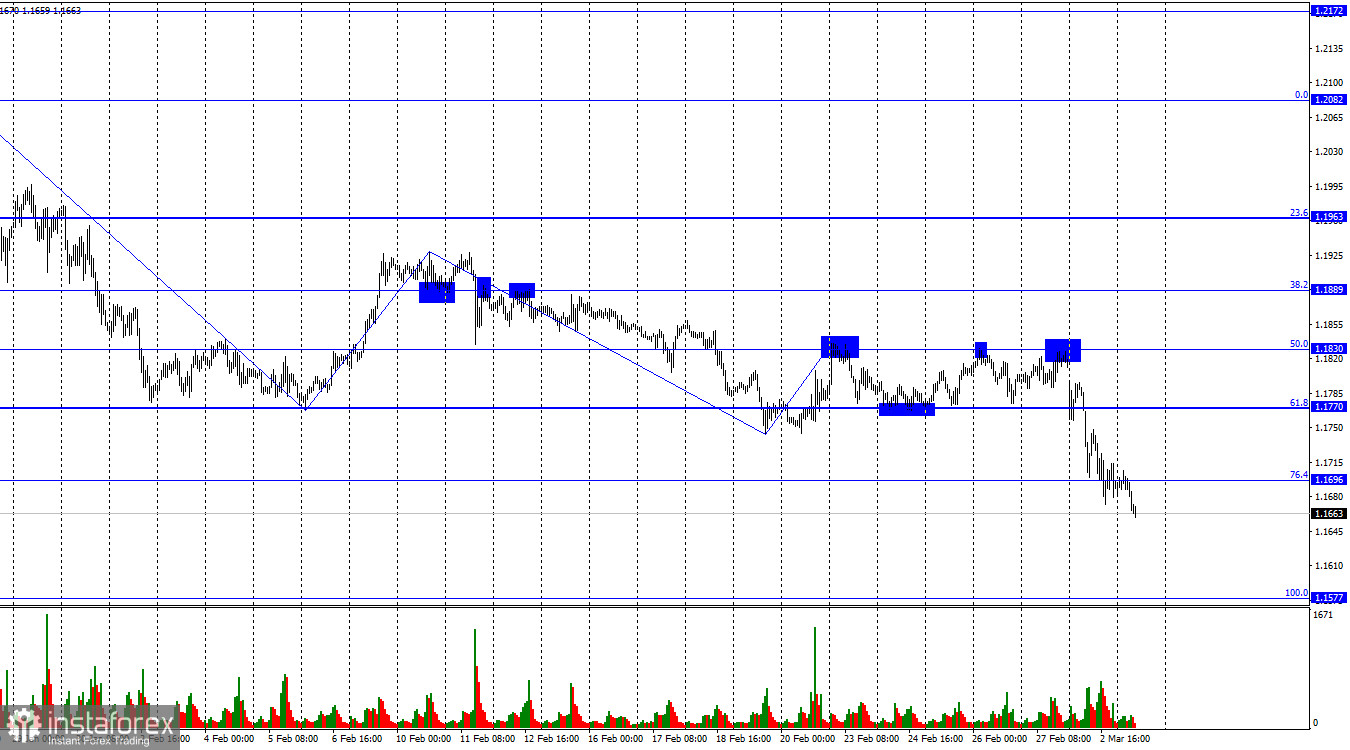
The wave structure on the hourly chart remains straightforward. The last completed upward wave failed to break the previous peak, while the new downward wave confidently broke the previous low. Therefore, the trend remains bearish. The bulls paused during what had been a large-scale advance, which would not have been possible without Donald Trump. However, Donald Trump's actions in the Middle East, which triggered large-scale military operations involving around a dozen countries, are now supporting the U.S. currency.
On Monday, the news background focused solely on the war in the Middle East. U.S. and Israeli military operations against Iran began on Saturday, so as soon as markets opened after the weekend, bears resumed selling pressure. In my view, the only reason for the dollar's growth on Monday is its status as a safe-haven currency, a status that had been significantly weakened last year. However, in 2026, traders have once again turned to buying the dollar. Military operations continue, while economic events have moved into the background. Yesterday, the U.S. ISM Manufacturing PMI was released — a report that traders typically pay close attention to. Even this index, overshadowed by geopolitical developments, supported the bears, as its February reading came in at 52.4 points versus expectations of no more than 51.8. Overall, the situation currently favors the U.S. dollar. The more the conflict in the Middle East intensifies, the more confident bears and the dollar are likely to remain.
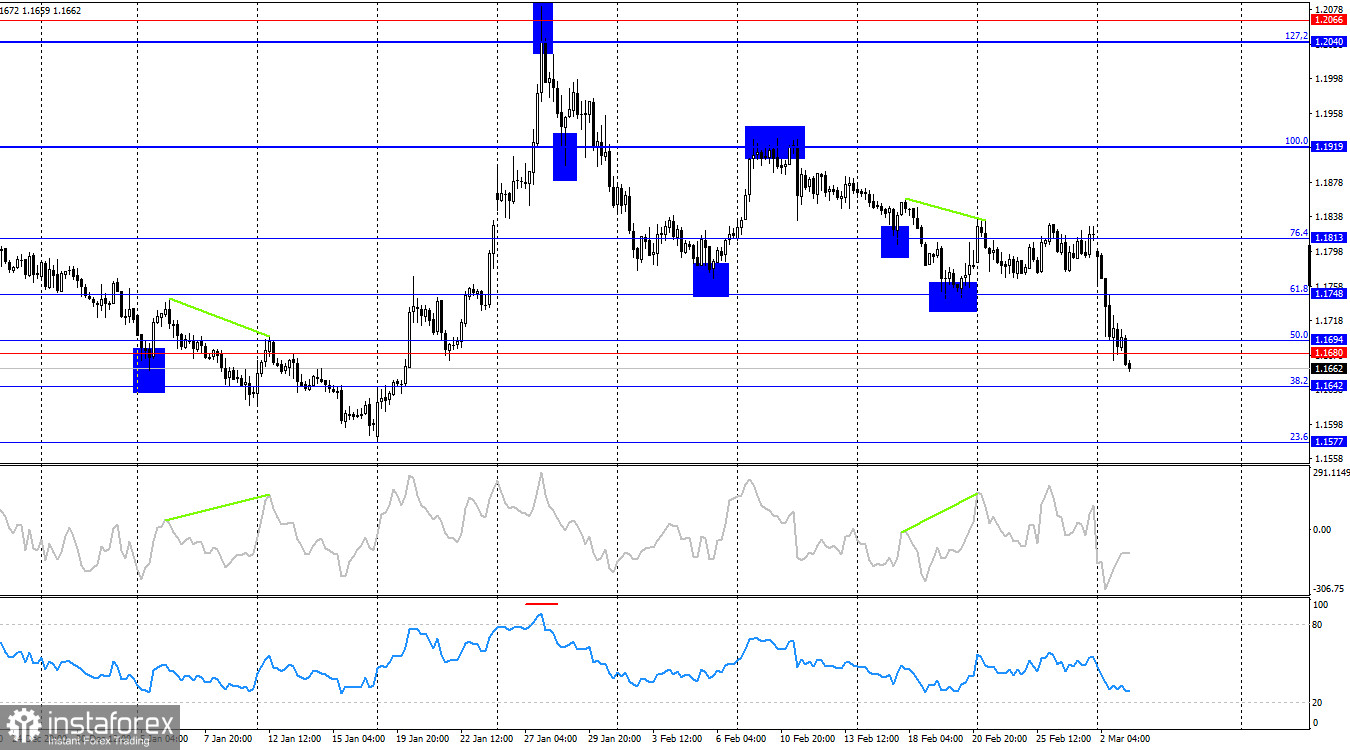
On the 4-hour chart, the pair reversed in favor of the U.S. dollar after a bearish divergence formed on the CCI indicator. Events in Iran then enabled a consolidation below the 1.1680–1.1694 support level. As a result, the decline may continue toward the levels of 1.1642 and 1.1577. No new emerging divergences are observed on any indicator.
Commitments of Traders (COT) Report:
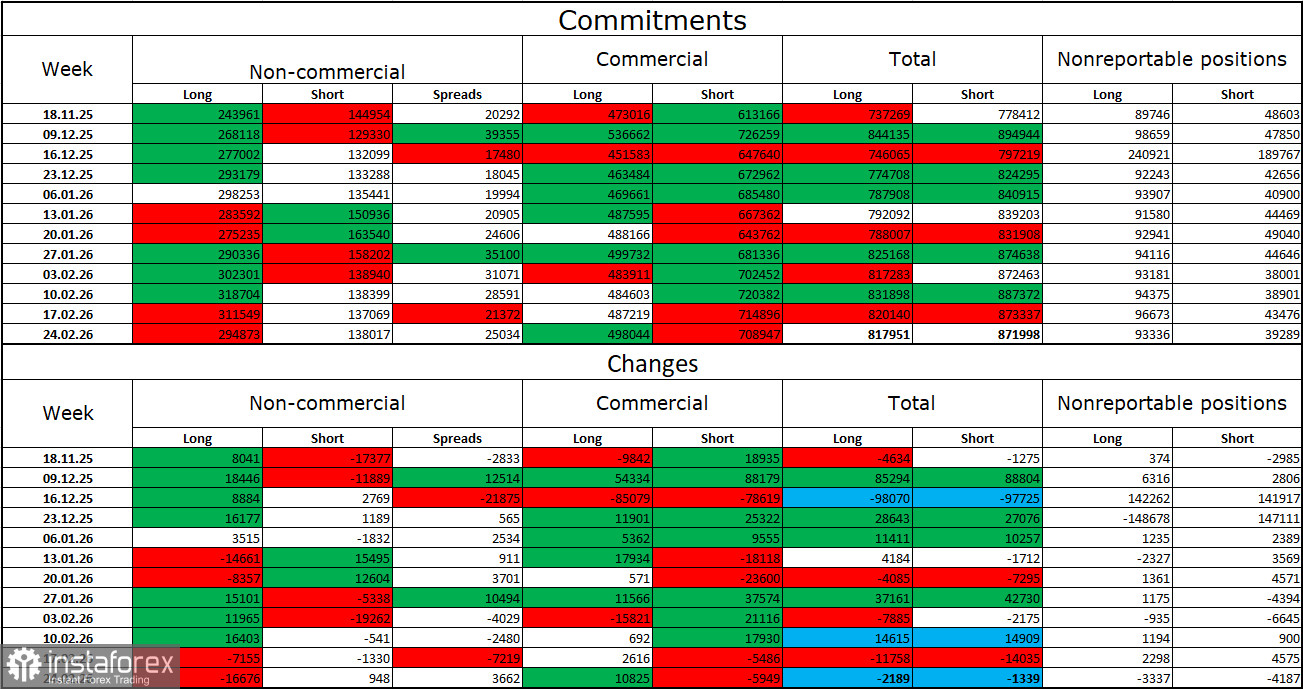
During the latest reporting week, professional traders closed 16,676 long positions and opened 948 short positions. The sentiment of the "Non-commercial" group remains bullish thanks to Donald Trump and his policies, but in recent weeks we have seen a reduction in long positions. The total number of long positions held by speculators now stands at 294,000, compared to 138,000 short positions. The bulls' advantage remains more than twofold.
Overall, in the long term, large players continue to reduce short positions and increase long positions. Global events — which have been abundant in recent years — continue to influence investors in different ways. At present, the market's full attention is focused on the Middle East, where the war continues to intensify and expand geographically. Thus, in the near term, the euro and dollar exchange rate will depend not on Donald Trump's policies but on the war in Iran.
News Calendar for the U.S. and the Eurozone:
Eurozone – Consumer Price Index (10:00 UTC).
On March 3, the economic calendar includes one relatively important release, but economic data may once again be overshadowed by geopolitical developments. The news background is likely to influence market sentiment throughout Tuesday.
EUR/USD Forecast and Trading Advice:
Short positions were possible following a rebound from the 1.1830 level on the hourly chart, with targets at 1.1770 and 1.1696. Both targets have been reached. Today, short positions may be kept open with a target at 1.1577. Under current circumstances, long positions are not recommended.
Fibonacci retracement levels are drawn from 1.1805–1.1578 on the hourly chart and from 1.1919–1.1471 on the 4-hour chart.

