यह भी देखें

 01.05.2026 07:24 AM
The situation in the cryptocurrency market continues to change in our favor. However, it is doing so very slowly, which raises some doubts about the ability of "digital gold" to begin a new phase of a downward trend at this time. Recall that in recent months, we have repeatedly stated that we are expecting a resumption of the downward trend. This week, for the first time in two months, a sell signal was formed on the daily timeframe. Overall, BTC has been in an upward correction for 2.5 months, but corrections eventually end. Bitcoin has bounced off the nearest "bearish" FVG on the daily timeframe twice. On the hourly timeframe, confirmation has been received in the form of a structure break with a breakdown of the last local low of $77,000. The upward structure has also been broken on the 4-hour timeframe (break of the CHOCH line). Thus, traders have received several signals indicating a trend change to downward in the short term. A short-term downward trend change could signify the beginning of a new phase of a downward trend in the medium term. Essentially, sell signals have already formed, so now traders can track "bearish" patterns to open trades in the main trend.
The meetings of three key central banks had virtually no impact on the movement of the first cryptocurrency. However, yesterday, Donald Trump Jr., the US President's son, showered praise on the first cryptocurrency. Trump Jr. stated that now is "the best time for Bitcoin." According to him, the last six months have been "fantastic" and "transformative." He described the asset as "sticky," noted the influx of institutional capital into the cryptocurrency market, and the reluctance of many people to sell Bitcoin. Institutions are increasing their demand, banks are accepting Bitcoin as mortgage collateral, and financial corporations are launching new ETFs. Thus, in the President's son's opinion, Bitcoin is poised for an amazing future. Since this amazing future has not yet arrived, we still expect a new decline in the first cryptocurrency.
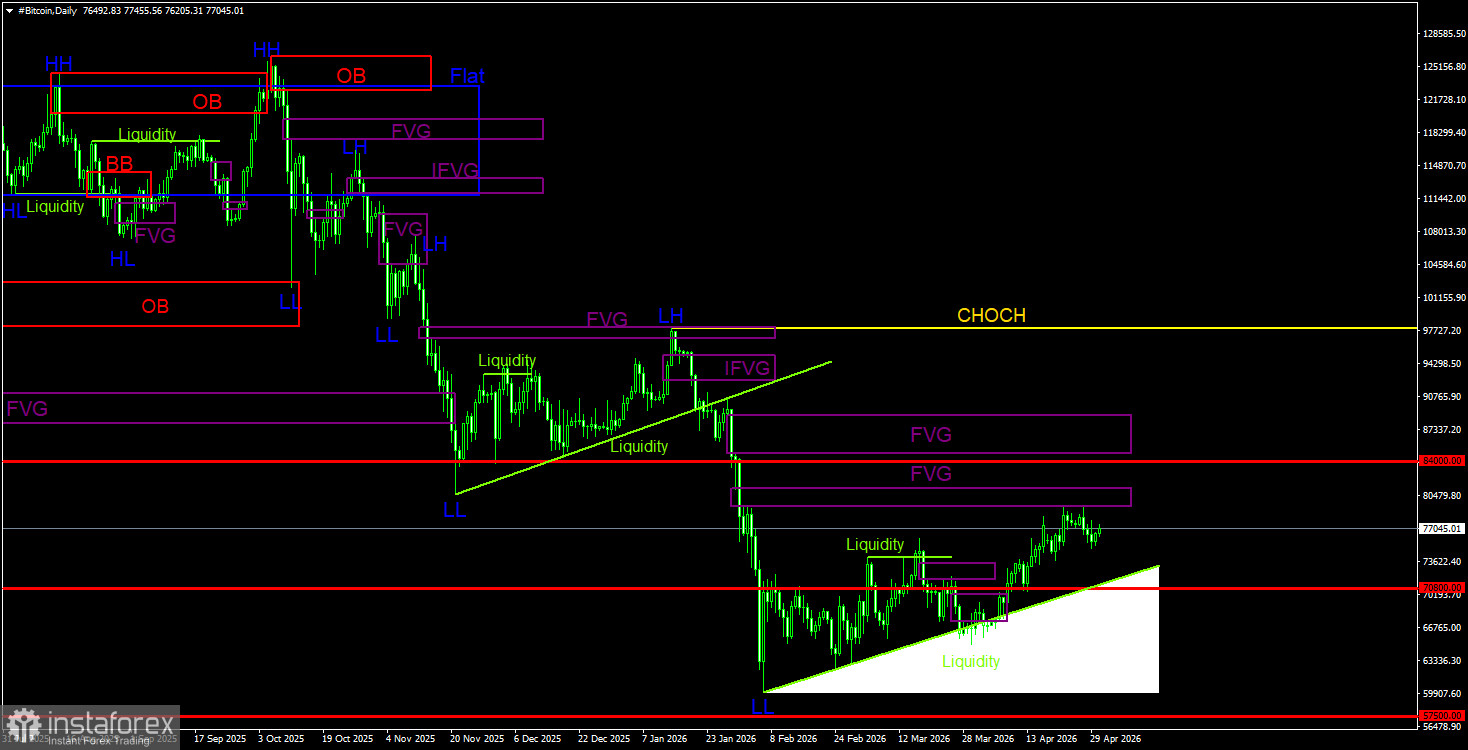
On the daily timeframe, Bitcoin continues to form a downward trend and a correction against it. The trend structure is identified as downward, and the CHOCH line remains at $97,900. Only above this level can it be considered that the downward trend has ended. Since there are no signs of a trend change to upward, we believe that the decline will resume. On the daily timeframe, the nearest POI area for new sell trades is between $79,500 and $81,100. This area has already been tapped twice, and confirmation has been formed on the hourly timeframe in the form of a break of the upward structure. The liquidity pool below the trend line remains a price target.
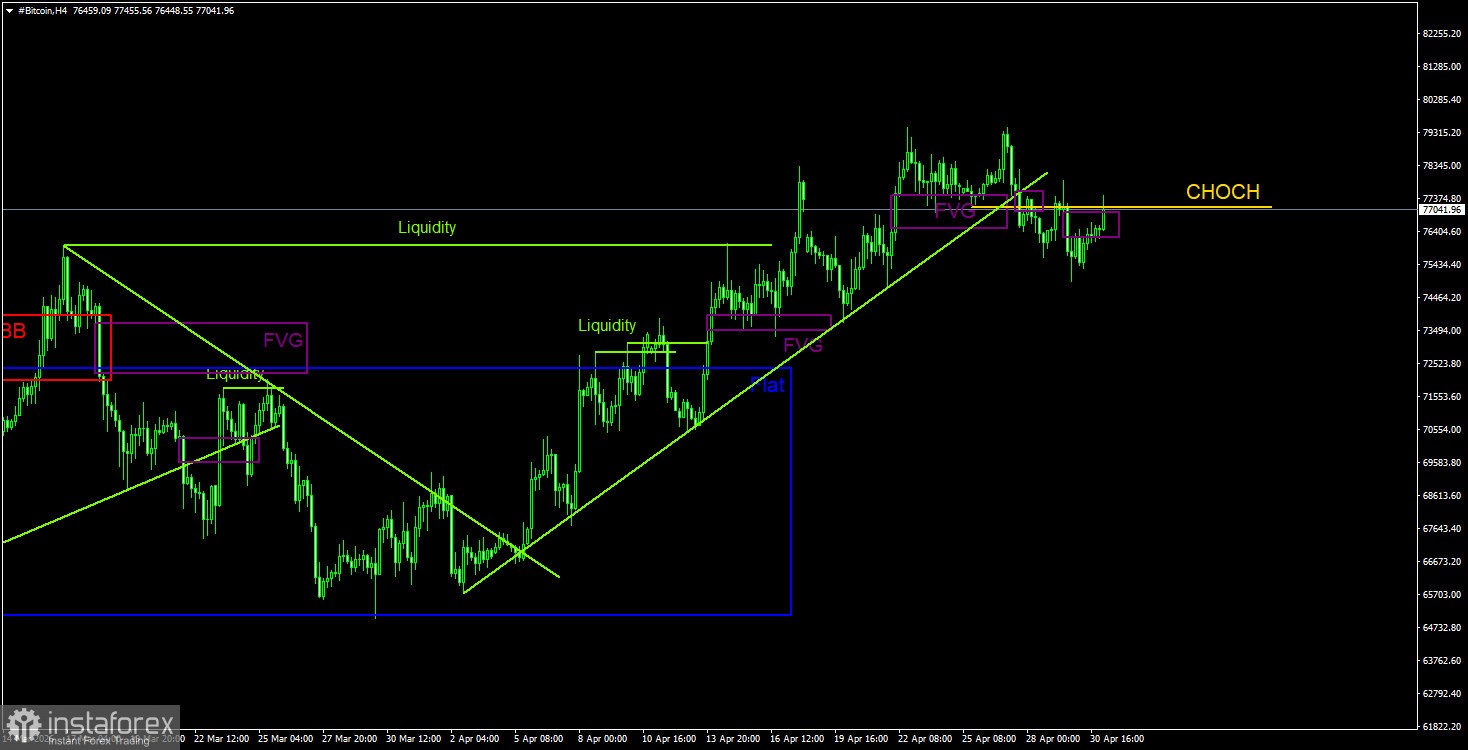
On the 4-hour timeframe, the price may complete the formation of the upward trend, as the upward structure has been broken (break of the CHOCH line). The nature of the cryptocurrency's movement remains maximally unappealing but quite ordinary for a correction. Further growth is highly questionable, as on the daily timeframe, the price has worked out the bearish FVG, near which the correction may be completed. The end of the upward trend could mark the start of a new phase on the daily timeframe. In the near future, we will consider bearish patterns and short positions.
Bitcoin continues to form a full-fledged downward trend and a correction against it. We continue to expect a decline, targeting $57,500 (the 61.8% Fibonacci level from a three-year upward trend), and there are currently no signs of a trend reversal. However, even the $57,500 level does not seem like a final stopping point. Among the POIs at this time, the nearest bearish FVG on the daily timeframe is located in the range of $79,300 - $81,200. The price reacted to it, confirmation has been formed on the hourly timeframe, and a structure break has occurred on the 4-hour timeframe. Therefore, it would be prudent to open short positions in the near future and track the formation of bearish patterns. The downside targets are below the $60,000 level.
CHOCH – break of the trend structure.
Liquidity – The liquidity of stop loss orders of traders, which market makers use to build their positions.
FVG – Area of price inefficiency. The price passes through these areas very quickly, indicating a complete lack of one side in the market. Subsequently, the price tends to return and react to these areas.
IFVG – Inverted area of price inefficiency. After returning to such an area, the price does not react to it but breaks through impulsively and then tests it from the other side.
OB – Order block. The candle on which the market maker opened a position with the aim of taking liquidity to form their position in the opposite direction.

