
यह भी देखें


 08.07.2026 04:24 AM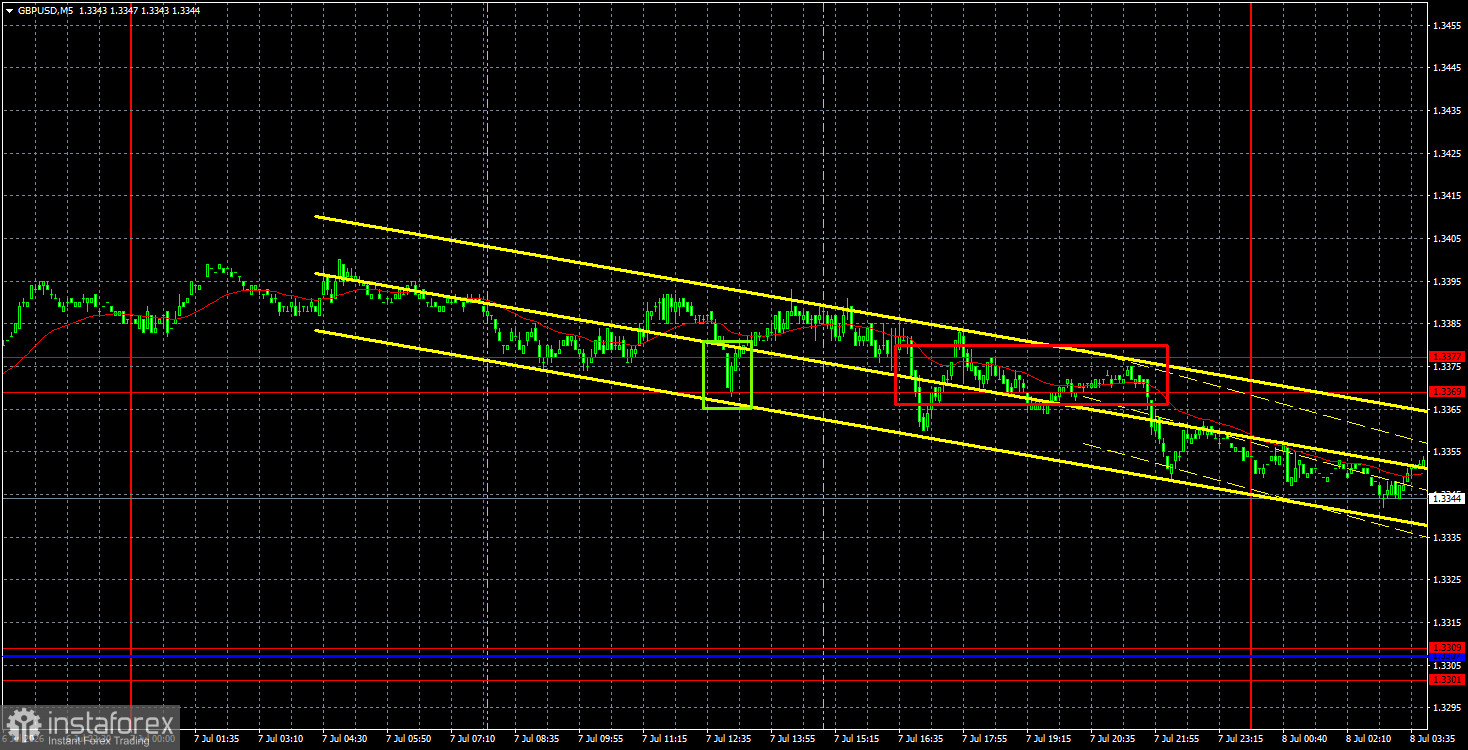
The GBP/USD currency pair traded with low volatility and a downward bias on Tuesday. It cannot be said that any events triggered the pair's decline yesterday; rather, it was simply an ordinary technical correction. There were no significant events or reports from the UK, and in the U.S., only the weekly ADP report was released. As a reminder, the Nonfarm Payrolls (NFP) report released last Thursday allowed the market to form its current assessment of the U.S. labor market. The ADP reports, even in their weekly variations, are seldom reacted to by the market, which prefers to wait for the Nonfarms. As a result, the British pound experienced a slight decline, but overall it remains within an upward trend. This movement is entirely logical and fair, given that the dollar has already exhausted all its favorable factors this year.
It was also reported overnight that the U.S. struck Iran again, which is unlikely to surprise anyone. Tehran and Washington will likely announce another violation of the deal's terms today, but they will remain engaged in the negotiation process, which is set to resume on June 11.
From a technical standpoint, the British pound remains within an upward trend, as clearly indicated by the trend line. The 1.3369-1.3377 area has been breached, allowing the British currency to continue building on its success. This week, there will be very few significant events, so traders can focus on technical analysis. We believe that the upward movement should at least continue within the sideways channel on the daily timeframe.
On the 5-minute timeframe, two trading signals were formed on Tuesday. During the European trading session, the price bounced from the 1.3369-1.3377 area, but the signal proved false, as it did not even move up by 20 pips. During the American trading session, the pair consolidated below the 1.3369-1.3377 area, allowing traders to open short positions targeting 1.3301-1.3309.
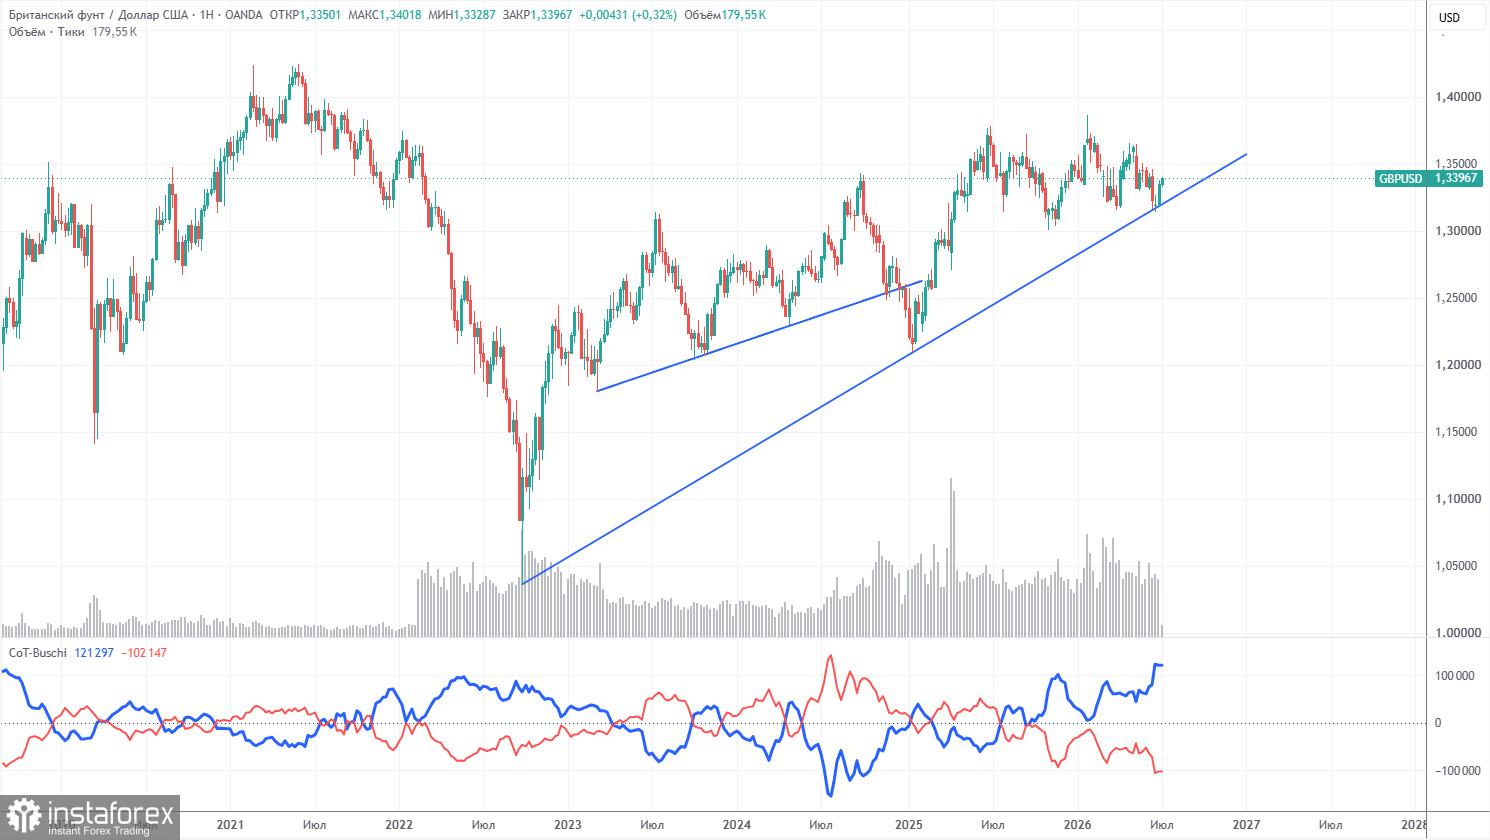
COT reports on the British pound show that commercial traders' sentiment has fluctuated in recent years. The red and blue lines showing the net positions of commercial and non-commercial traders often cross and are generally close to the zero mark. Currently, the lines are diverging, with non-commercial traders still dominating but now predominantly holding short positions. Given events in the Middle East, it is not surprising that demand for riskier currencies was weak in 2026. However, the war is over, and there are no longer strong reasons to buy the dollar, while the British pound has not declined significantly in the long term despite low demand from professional players.
In the long term, the dollar will continue to decline due to Donald Trump's policies, which is evident on the weekly timeframe. The trade war will persist in one form or another for a long time, and Trump's policies are aimed, both directly and indirectly, at weakening the American currency. The long-term upward trend remains, as indicated by the trend line. Last week, the price touched this line and bounced back. According to the latest COT report (dated June 30), the "Non-commercial" group closed 3,600 BUY contracts and opened 7,200 SELL contracts. Thus, the net position for non-commercial traders decreased by 3,600 contracts over the week.
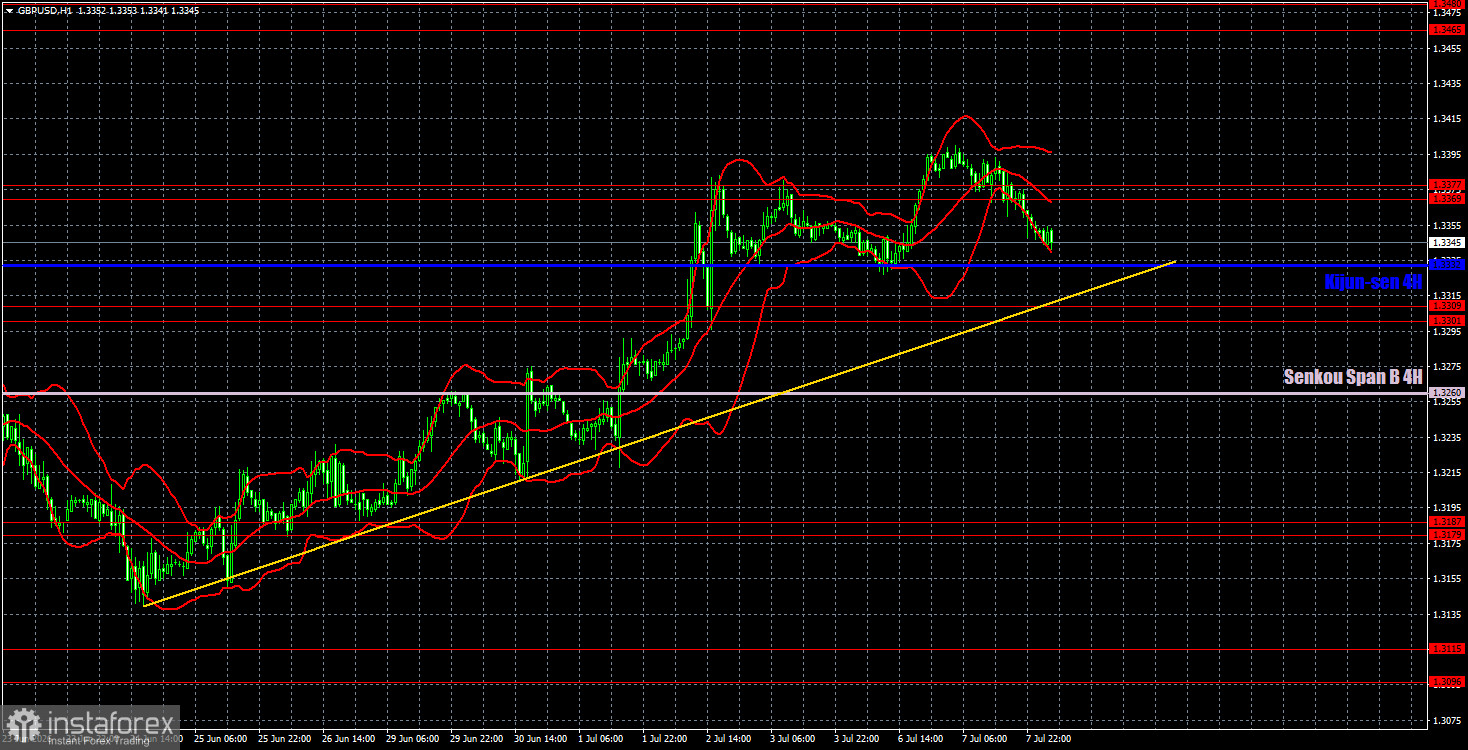
On the hourly timeframe, the GBP/USD pair continues to form an upward trend. In the long term, the British pound still has few reasons to decline, while the U.S. dollar has few reasons to grow. Recently, the market has largely ignored fundamental, geopolitical, and macroeconomic events, and on the daily timeframe, the pair is at the lower end of the sideways range. Therefore, we continue to expect upward movement.
For July 8, we highlight the following important levels: 1.3042-1.3050, 1.3096-1.3115, 1.3179-1.3187, 1.3301-1.3309, 1.3369-1.3377, 1.3465-1.3480, 1.3588, and 1.3671-1.3681. The Senkou Span B line (1.3260) and Kijun-sen (1.3332) may also act as sources of signals. It is recommended to set a Stop Loss at breakeven if the price moves in the right direction by 20 pips. The Ichimoku indicator lines may shift throughout the day, which should be taken into account when determining trading signals.
On Wednesday, there are no significant events or publications scheduled in the UK, while in the U.S., the minutes from the last FOMC meeting will be released. We consider this event formal and secondary, as minutes are published three weeks after the meeting. Thus, the information they contain is likely to lose its relevance.
Today, traders may maintain short positions targeting the 1.3301-1.3309 area, as the pair consolidated below the 1.3369-1.3377 area yesterday. Long positions can be opened if there is a bounce from the critical 1.3301-1.3309 area, targeting 1.3369-1.3377.

