
यह भी देखें


 23.07.2026 06:33 AM
Bitcoin has recovered to $8,000 and is likely to continue moving toward the only bearish FVG (Fair Value Gap) on the daily chart. In any case, on the daily timeframe, this is the only POI (Point of Interest) area for new short positions. Remember that any rise in Bitcoin at this time is a correction, and corrections can end at any moment, not necessarily within any specific pattern. Bitcoin continues to trade near its annual lows, and most independent and unbiased experts predict further declines. We fully agree with these forecasts and believe that the downward trend is not over. There are no signs of an end to the bearish trend: there are no bullish patterns or breaks in the bearish structure. The fundamental backdrop also remains negative: the Federal Reserve does not intend to lower key rates in 2026, capital continues to flow into the AI sector, spot demand for Bitcoin remains weak, geopolitics is unstable, and miners are shifting their equipment to meet the demands of artificial intelligence. We see no reason for a significant rise in "digital gold."
Meanwhile, Bloomberg reported that the cumulative losses of crypto-related companies from the current Bitcoin downturn amount to tens of billions of dollars. Since October last year, the value of crypto assets held by these companies has dropped from $120 billion to $75 billion. Reports indicate that in 2025, amid Donald Trump's favorable attitude toward Bitcoin, many companies began to adopt the strategy of Michael Saylor's company. The implications of this are well understood by all. The unwavering belief in Bitcoin's eternal rise forces companies to incur losses, abandon projects, and halt expansions. Many are even selling "digital gold," which shows smaller gains with each new four-year cycle. Some companies are abandoning their Bitcoin buying strategy in favor of other investment directions. Even Strategy has begun selling Bitcoin, setting a bad example for other market participants. Thus, we still do not see strong reasons for a rise in the first cryptocurrency.
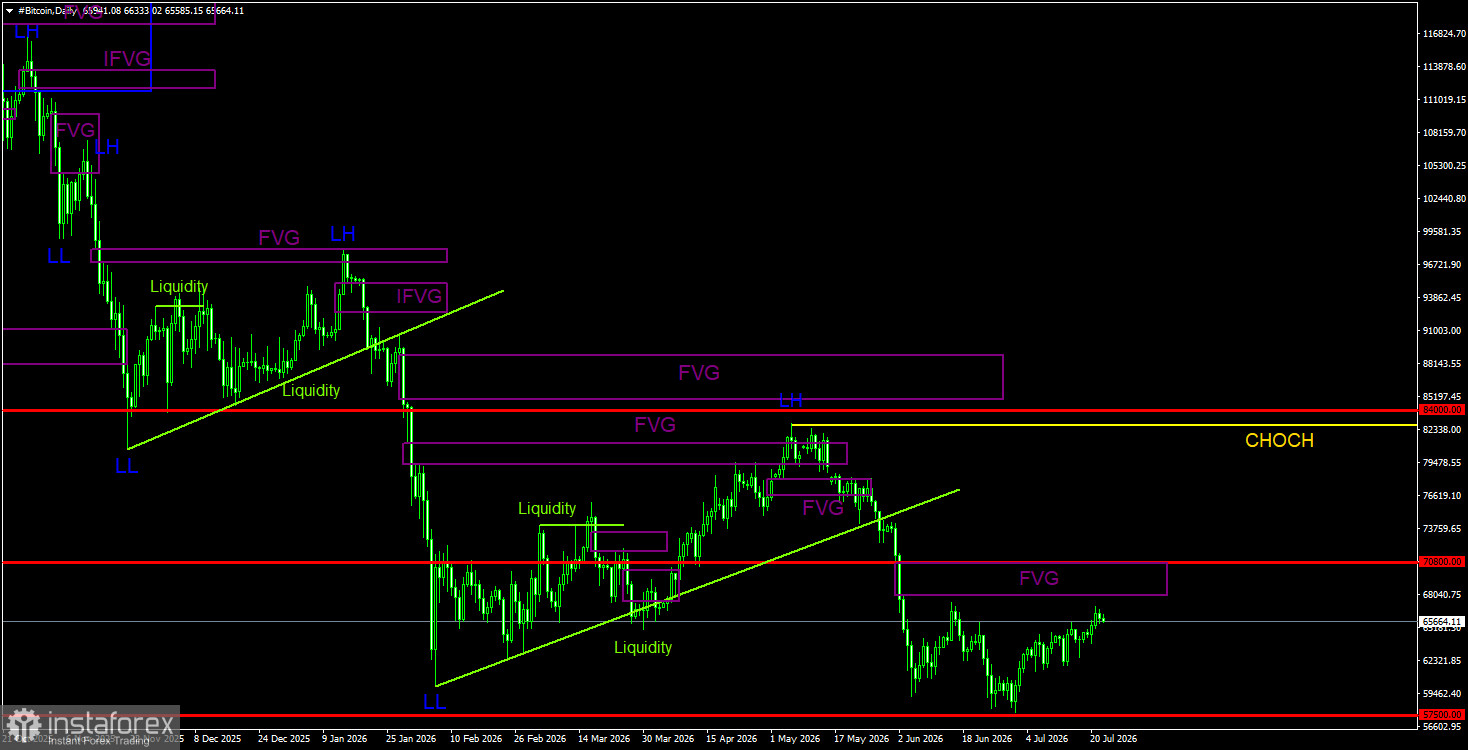
On the daily timeframe, Bitcoin continues to form a downward trend. The trend structure is identified as bearish, and the CHOCH (Change of Character) line is now at $82,800, as a new LL (Lower Low) has been formed. Only above this level can it be considered that the downward trend has ended. Since there are still no signals of an upward trend reversal, we believe the decline will continue. A bearish FVG has been formed in the range of $68,000 - $70,700, which serves as the only POI area for sell positions.
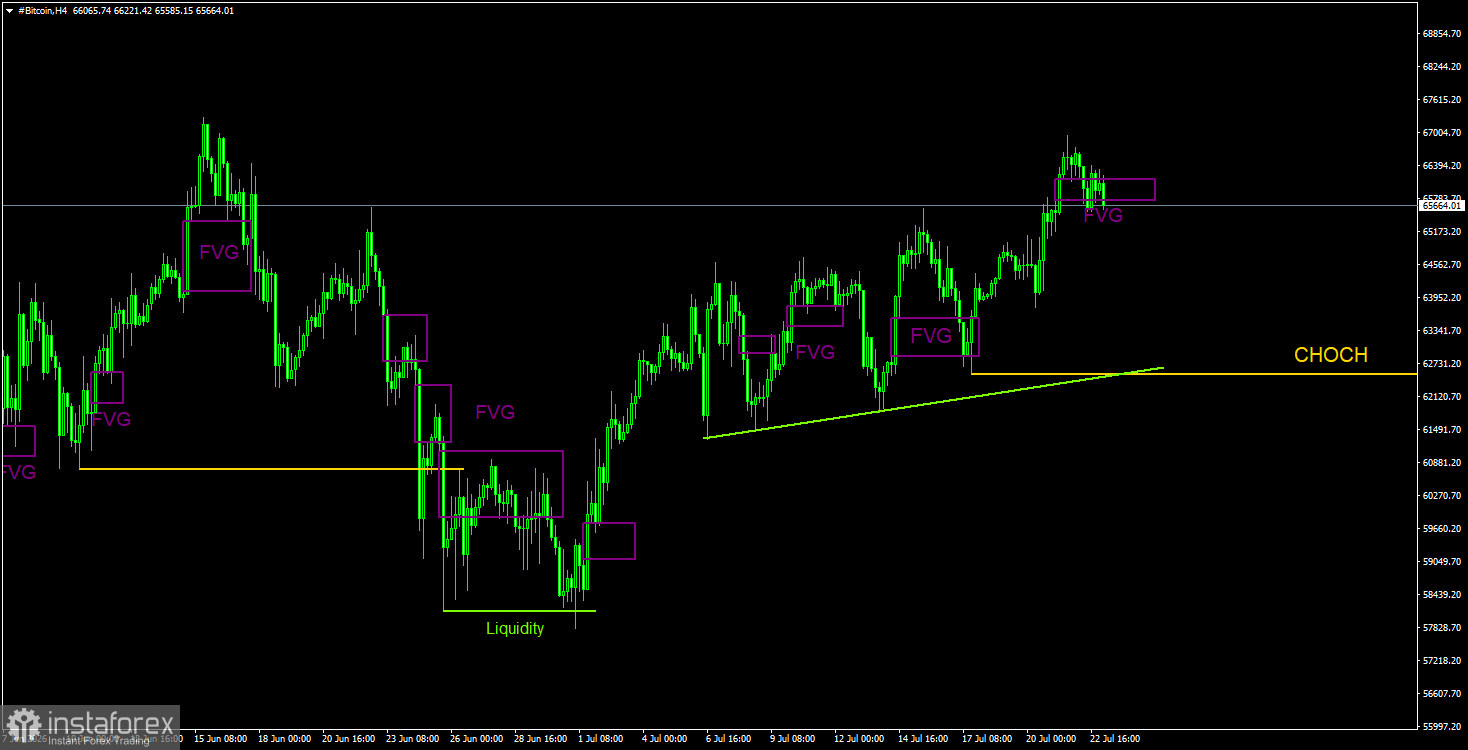
On the 4-hour timeframe, Bitcoin is in a downward trend; however, the overall correction is not yet complete. After liquidity for buying was taken out, a price increase began, as we warned. Recently, only small local FVGs have been formed, and reactions to them have typically been very weak. The price reacted to the penultimate bullish FVG, allowing traders to open long positions. However, the last bullish FVG has not yet provided any price reaction. If this pattern is invalidated, it will be the first sign of the end of the upward correction phase. Recall that any rise in Bitcoin now is inherently a correction. Whether or not to capitalize on the correction is up to each trader's decision. We note a liquidity pool below the trend line, which the price is likely to hit with a 90% probability.
Bitcoin continues to develop a full-fledged downward trend. We continue to expect a decline targeting $57,500 (the 61.8% Fibonacci level from the three-year upward trend), although this level has essentially already been reached. However, we do not believe that the downward trend will end here. The last bearish FVG was formed in the range of $68,000 - $70,700 on the daily timeframe, so this area serves as the POI for short positions in the coming weeks. On the 4-hour timeframe, Bitcoin continues the second wave of this correction, but sell trades remain more attractive. Short-term long positions are permissible, but it is important to understand that the trend remains downward.

