
यह भी देखें


 03.08.2026 09:04 AM
Analysis:
The primary direction of the euro's main currency pair continues to be defined by the bearish wave that began in January of this year. Over the past two months, a corrective phase in the form of an expanded flat has been developing within this wave structure. The final segment of this wave is currently taking shape.
Forecast:
The upward bias is expected to continue during the coming week. After a likely test of the resistance zone, the pair may reverse and decline toward the support zone. The expected weekly price movement is likely to remain within the nearest opposing support and resistance zones.
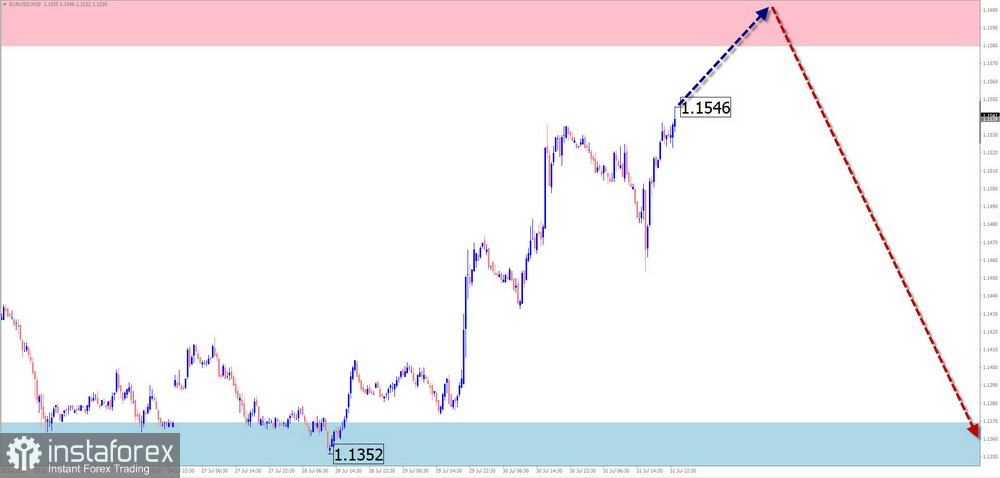
Potential Reversal Zones
Resistance:
Support:
Recommendations:
Buy: Upward potential is limited. Small-volume positions may be considered during individual trading sessions.
Sell: Selling opportunities may arise after confirmed reversal signals appear near the projected resistance zone. Keep in mind that the downside potential is expected to remain limited.
USD/JPY
Analysis:
The short-term trend in USD/JPY has been driven by an upward wave that started at the end of April. The corrective wave (B), which formed as an expanded flat, now appears complete. The upward movement that began on July 30 has reversal potential. If confirmed, it may mark the beginning of a new leg of the primary trend.
Forecast:
At the beginning of the week, the Japanese yen is likely to remain under bearish pressure, implying upward movement in USD/JPY. Price is expected to find support near the projected support zone before reversing higher. A brief test of the lower boundary of the reversal zone cannot be ruled out. The projected resistance marks the upper limit of the expected weekly range.
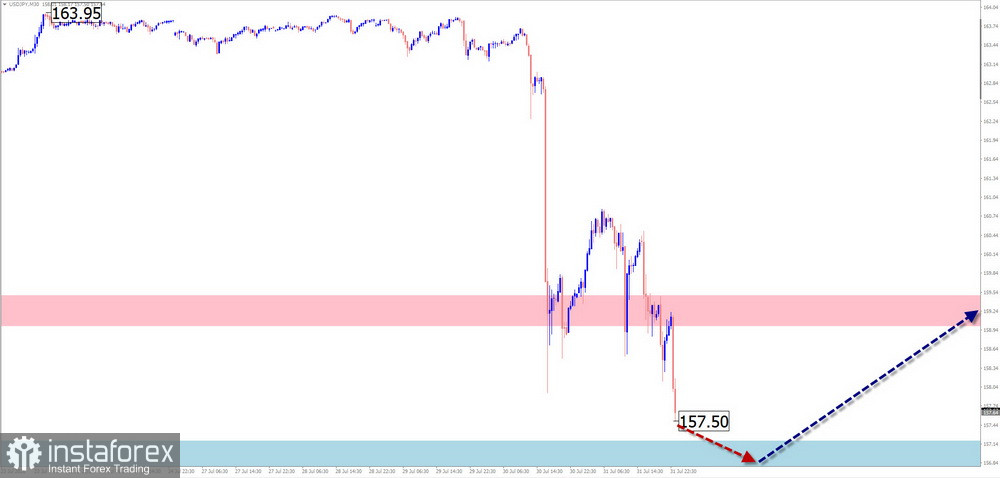
Potential Reversal Zones
Resistance:
Support:
Recommendations:
Buy: Buying opportunities may emerge after confirmed signals appear near the support zone.
Sell: Selling is risky and offers limited profit potential.
GBP/JPY
Analysis:
Over recent months, the British pound has continued to strengthen steadily against the Japanese yen. Since mid-July, after reaching the lower boundary of a major resistance zone, the pair has been forming a corrective phase. The final segment of this wave pattern began at the end of last week. The upward movement that started on July 30 also has reversal potential.
Forecast:
At the beginning of the week, GBP/JPY is expected to trade mostly sideways near the projected support zone. A temporary move toward the lower boundary of the zone is possible. Later in the week, the pair may reverse and resume its upward movement toward the projected resistance levels.
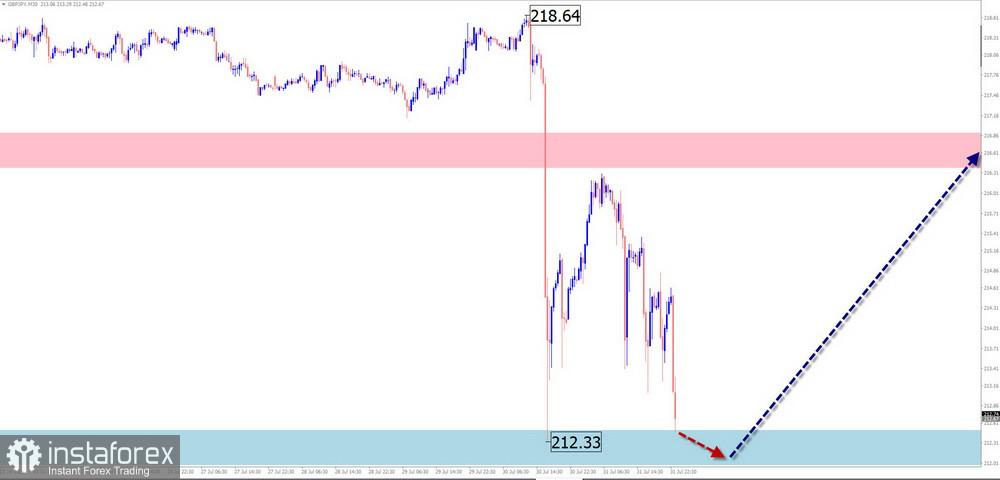
Potential Reversal Zones
Resistance:
Support:
Recommendations:
Sell: No trading opportunities.
Buy: Buying may become appropriate once confirmed reversal signals appear within the projected reversal zone according to your trading system.
USD/CAD
Analysis:
An upward wave has been developing in USD/CAD since the beginning of May. Since mid-June, a counter-trend corrective movement in the form of an expanded flat has been forming within this structure. The wave still lacks its final segment.
Forecast:
The overall bearish correction is expected to continue during the coming week until it is completed near the support zone. A temporary upward pullback toward the resistance zone is possible during the first part of the week. The probability of increased volatility and renewed price declines is expected to rise closer to the weekend.
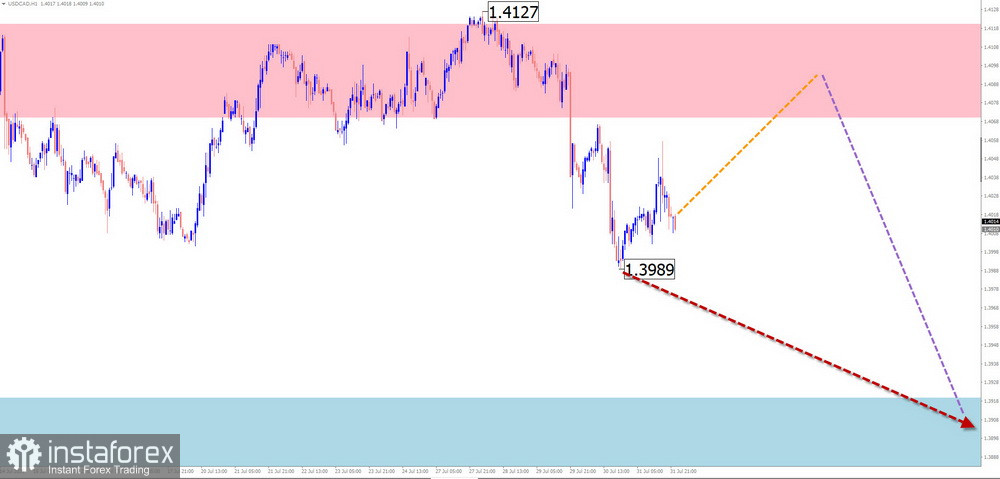
Potential Reversal Zones
Resistance:
Support:
Recommendations:
Buy: No trading opportunities.
Sell: Intraday selling may be considered once confirmed signals appear according to your trading system.
NZD/USD
Brief Analysis:
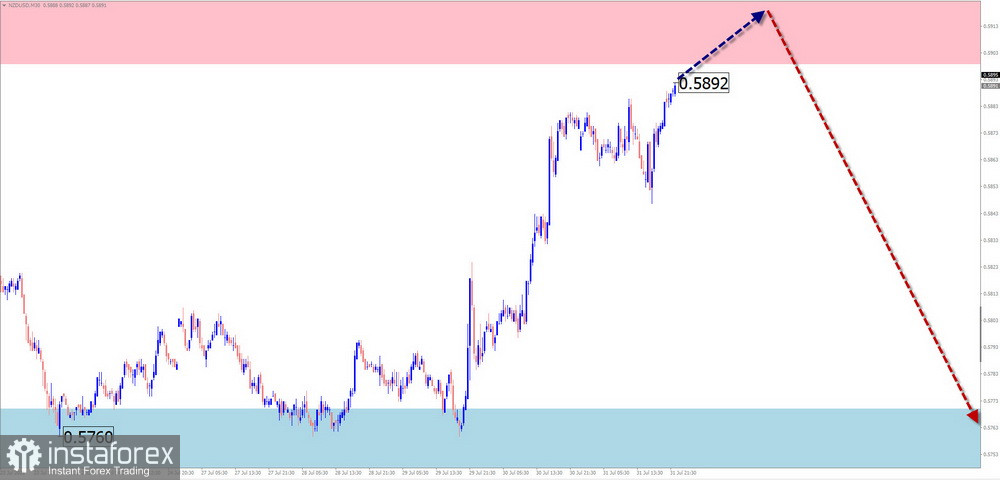
The downward wave that has been defining the trend in NZD/USD since the end of May remains in progress. The unfinished portion is corrective in nature. The wave is developing as an expanded flat and is approaching completion. The pair has reached the lower boundary of the daily time frame's potential reversal zone.
Weekly Forecast:
During the first half of the week, sideways trading with a slight upward bias is the most likely scenario. A test of the upper boundary of the resistance zone is possible. After that, a reversal is expected, followed by renewed downward movement.
Potential Reversal Zones
Resistance:
Support:
Recommendations:
Sell: Selling opportunities may arise during individual trading sessions after confirmed reversal signals appear according to your trading system.
Buy: Upward potential is extremely limited and long positions may prove unprofitable.
Bitcoin
Brief Analysis:
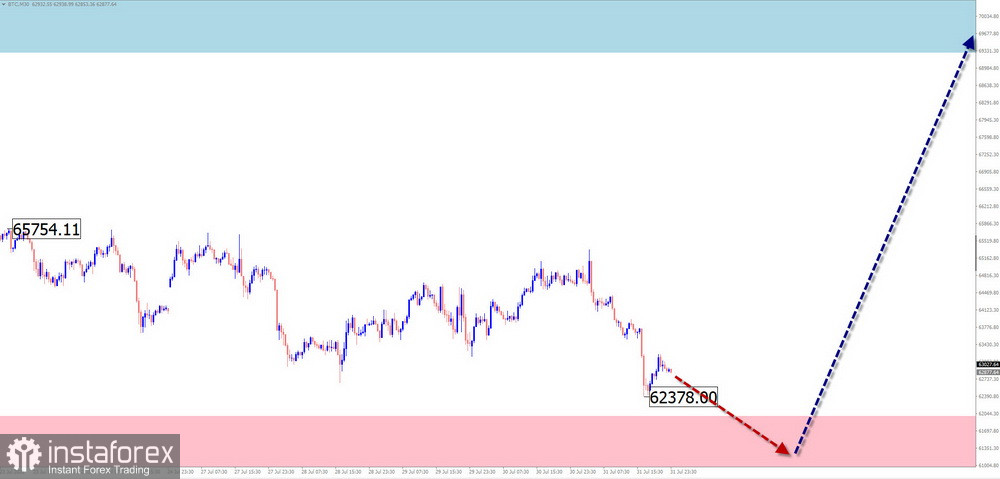
Bitcoin has been developing an unfinished bullish wave structure since February of this year. Prices have been moving primarily sideways. Wave analysis indicates that corrective wave (B), which forms part of the final phase of the current structure, is nearing completion. There are currently no signs of an imminent trend reversal.
Weekly Forecast:
At the beginning of the week, Bitcoin is likely to remain in a downward-moving range. A test of the support zone cannot be ruled out, after which price may continue to trade sideways. The probability of renewed bullish momentum increases toward the weekend.
Potential Reversal Zones
Resistance:
Support:
Recommendations:
Sell: Selling is risky and offers limited potential.
Buy: Buying opportunities may become relevant once confirmed signals appear near the support zone according to your trading system.
Gold
Analysis:
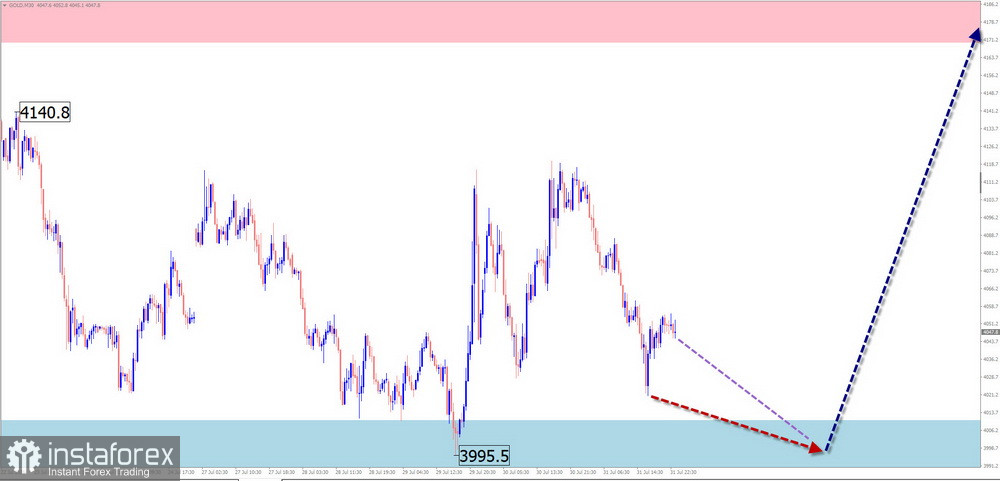
Gold's unfinished bearish wave pattern has been developing since the end of January. The price extremes form a descending pennant pattern. Wave analysis suggests that the final segment of the current structure has yet to develop. The current price is located within a cluster of potential reversal zones across multiple time frames.
Forecast:
During the first half of the week, another test of the support zone is expected. Afterward, the market may reverse and begin moving higher toward the projected resistance zone.
Potential Reversal Zones
Resistance:
Support:
Recommendations:
Sell: The upward potential following the expected rebound is limited. If selling, it is preferable to trade small position sizes during individual trading sessions.
Buy: The expected upward move has limited potential. Reducing position size may help manage risk.
Notes: In Simplified Wave Analysis (SWA), every wave consists of three segments (A–B–C). The latest unfinished wave is analyzed on each time frame. The dashed lines on the charts indicate the expected price movement.
Attention: The wave algorithm does not take into account the duration of market movements over time.

