
यह भी देखें


 26.08.2026 09:36 AM
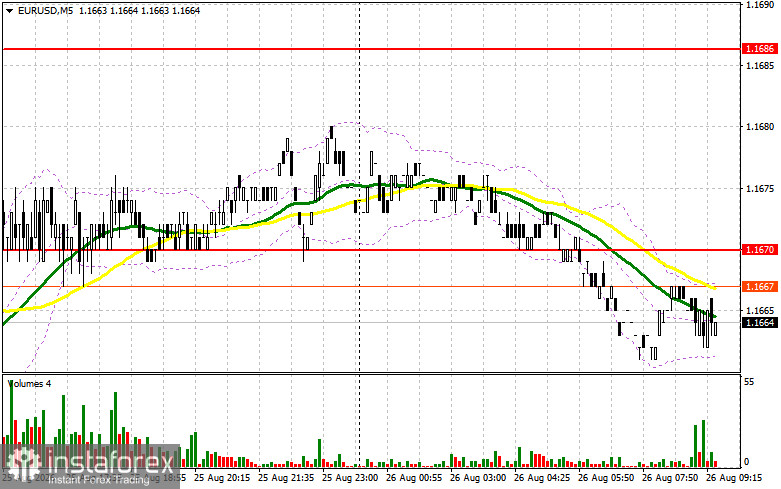
Yesterday, only one entry point into the market was formed. Let's take a look at the 5-minute chart and analyze what happened there. In my morning forecast, I pointed out the level of 1.1670 and planned to decide on entering the market from that level. The rise and formation of a false breakout around 1.1670 created an entry point to sell the euro, resulting in a slight 10-pip decline for the pair. In the second half of the day, even after the American data, the market showed very low volatility, so I was left without signals.
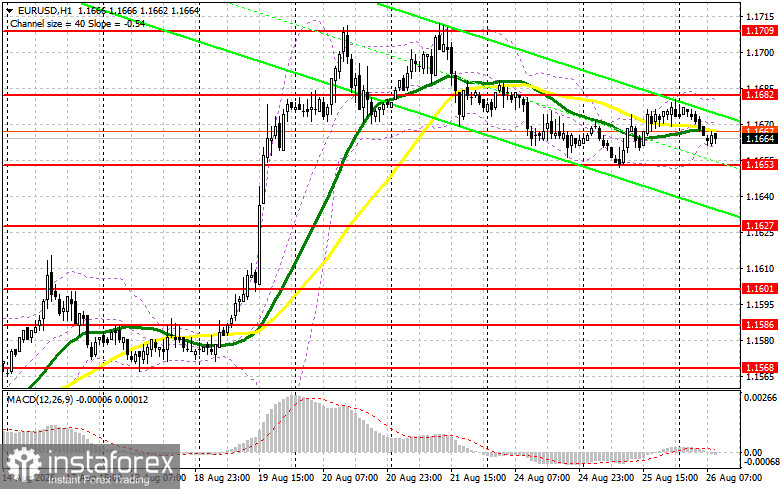
The dollar reacted by declining to the released data. The Conference Board consumer confidence index in the U.S. fell by 0.8 points to 89.4 in August from 90.2 in July, marking the second consecutive month of decline. New home sales in the U.S. in July also disappointed, amounting to 607,000 on an annual basis. This is 10.5 percent lower than the June level, indicating difficulties in this sector. Today, there are no data from the Eurozone in the first half of the day, so the EUR/USD pair will remain within the sideways channel, maintaining the chances for a continuation of the bullish market. If the euro declines, buyers will have to defend the nearest support at 1.1653, formed at the end of yesterday. Only the formation of a false breakout there will provide a reason for long positions aimed at rising to the resistance at 1.1682. A breakout and a reverse test of this range will confirm the correct action for longs, already expecting a stronger surge toward the resistance at 1.1709, where I expect more active bear activity. The most distant target will be the high of 1.1727, where I will take profit. Testing this level will continue the trend's development. In the event of a decline in EUR/USD and a lack of activity around 1.1653, the pair may demonstrate a larger decline. In this case, sellers will try to reach the next interesting level of 1.1627. Only the formation of a false breakout there will be a suitable condition for buying the euro. Long positions will be opened immediately on a rebound from 1.1601 with the aim of an upward correction of 30-35 pips intraday.
Euro sellers tried once again yesterday to trigger a larger decline in the euro, but American data spoiled everything. Today, the bears' main task in the first half of the day will be to defend the resistance at 1.1682. Only a false breakout there will be a reason for short positions with the aim of declining to support at 1.1653. A breakout and consolidation below this range, as well as a reverse test from the bottom to the top, will allow for a larger sell-off of the pair, creating an additional option to open short positions as the pair moves towards 1.1627. The most distant target will be the area of 1.1601, where I will take profit. In the case of an upward movement in EUR/USD, and with no active action by bears around 1.1682, where the moving averages are slightly lower, the euro may reach the high of 1.1709. I will sell there only after an unsuccessful consolidation. I plan to open short positions immediately on a rebound from 1.1727 with the aim of a downward correction of 30-35 pips.
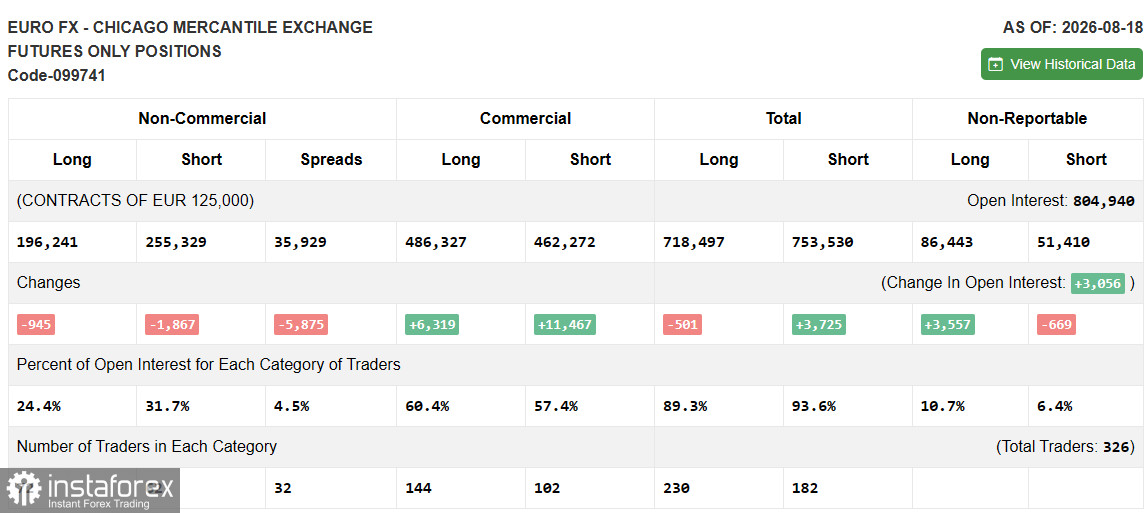
In the COT report (Commitment of Traders) for August 18, a reduction in long and short positions was observed. The euro market has remained unchanged for the fourth consecutive time — the OI has hardly changed, positions are standing still. Speculators have held a net short position of around 59,000 for a month, without increasing or closing. Everyone is waiting for September 1 and the August inflation data, as well as September 10 — the ECB's interest rate decision. The probability of a rate hike is about 70%. If the European Central Bank raises borrowing costs, the accumulated short position positions of speculators may fuel a sharp rebound in the euro. Commercial hedgers, meanwhile, quietly maintain a net long of +24,000 for the fourth consecutive week.
Moving Averages
Trading is taking place around the 30- and 50-day moving averages, indicating the sideways nature of the market.
Note: The period and prices of moving averages are considered by the author on the hourly chart H1 and differ from the overall definition of classic daily moving averages on the daily chart D1.
Bollinger Bands
In the event of a decline, the indicator's lower boundary around 1.1660 will act as support.
• Moving average (MA, defines the current trend by smoothing volatility and noise). Period – 50. Shown in yellow on the chart;• Moving average (MA, defines the current trend by smoothing volatility and noise). Period – 30. Shown in green on the chart;• MACD indicator (Moving Average Convergence/Divergence – convergence/divergence of moving averages). Fast EMA – period 12. Slow EMA – period 26. SMA – period 9;• Bollinger Bands (Bollinger Bands). Period – 20;• Non-commercial traders – speculators such as individual traders, hedge funds, and large institutions using the futures market for speculative purposes and meeting certain requirements;• Long non-commercial positions represent the total long open position of non-commercial traders;• Short non-commercial positions represent the total short open position of non-commercial traders;• The total non-commercial net position is the difference between the short and long positions of non-commercial traders.

