
यह भी देखें


 26.10.2026 01:23 PM
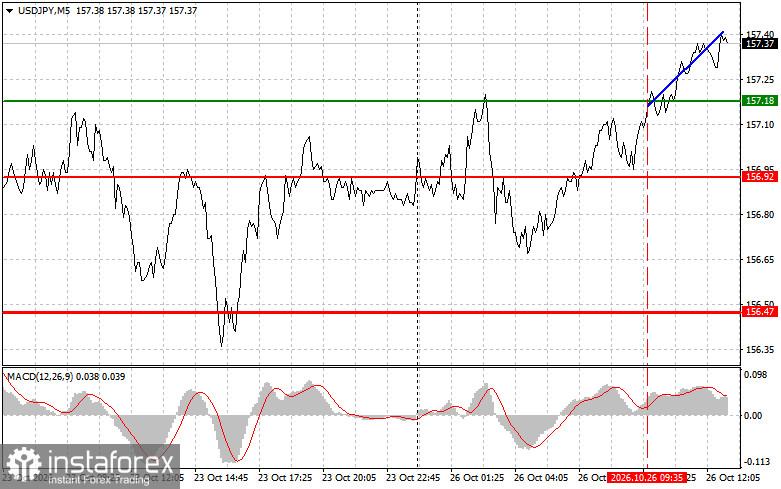
The test of the 157.18 price level during the first half of the day occurred just as the MACD indicator was beginning to move upward from the zero line, confirming the validity of the entry point for a long position on the US dollar. As a result, the pair rose by more than 20 points.
Oil prices remain the main risk factor for the yen. Japan depends on energy imports, which it pays for in US dollars. Therefore, every increase in oil prices widens the trade deficit and, in turn, increases demand for the US currency. There are no US economic data releases scheduled for the second half of the day, and no Fed officials are due to speak. As a result, the market will focus on the US war with Iran, which continues to put pressure on oil prices and support the dollar.
The Japanese report released in the morning provided no new information. The Leading Economic Index for August remained unchanged at 118.0, matching both the previous reading and the forecast. This composite index is based on several indicators and is intended to predict economic activity over the coming months. Its reading confirmed that there is no clear upward momentum, but neither is there evidence of a downward reversal. For the market, this neutral result provides little reason for a significant move.
The Bank of Japan's meeting on October 30 remains the key event, with the market assigning a probability of around 25% to an interest rate hike. As a reminder, inflation stood at 2.1% last Friday, while the core inflation index rose to 2.1% from 1.8% previously. Until the meeting, USD/JPY is likely to remain sensitive to oil prices and bond yields, while elevated oil prices are likely to prevent the yen from strengthening significantly.
As for the intraday trading strategy, the focus will be on the implementation of Scenarios No. 1 and No. 2.
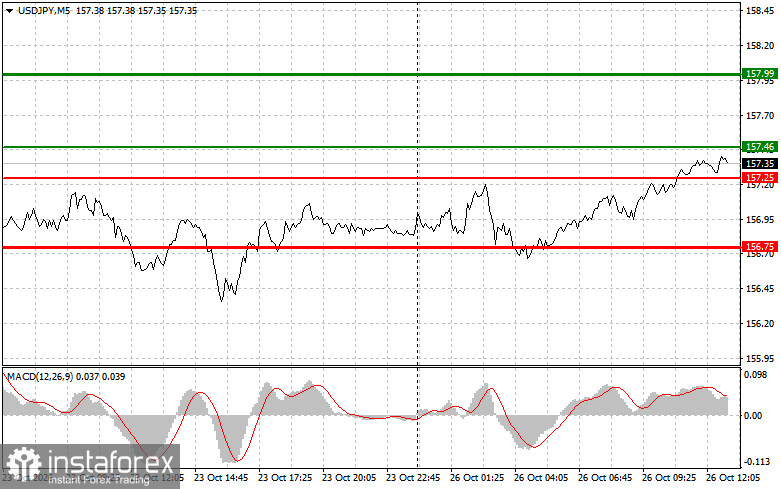
Scenario No. 1: USD/JPY can be bought today if the price reaches the entry area around 157.46 (the green line on the chart), with a target of 157.99 (the thicker green line on the chart). Near 157.99, the long position can be closed and a short position opened in the opposite direction, targeting a move of 30–35 points away from that level. The pair may rise today, although the upward potential appears limited. Important: Before buying, make sure that the MACD indicator is above the zero line and has just begun to rise from it.
Scenario No. 2: USD/JPY can also be bought today if the price tests 157.25 twice consecutively while the MACD indicator is in oversold territory. This would limit the pair's downward potential and trigger an upward market reversal. A rise toward the opposite levels of 157.46 and 157.99 can then be expected.
Scenario No. 1: USD/JPY can be sold today after the price breaks below 157.25 (the red line on the chart), potentially triggering a rapid decline in the pair. The sellers' main target is 156.75, where the short position can be closed and a long position opened immediately in the opposite direction, targeting a move of 20–25 points away from that level. Selling pressure on the pair could return if the central bank intervenes. Important: Before selling, make sure that the MACD indicator is below the zero line and has just begun to decline from it.
Scenario No. 2: USD/JPY can also be sold today if the price tests 157.46 twice consecutively while the MACD indicator is in overbought territory. This would limit the pair's upward potential and trigger a downward market reversal. A decline toward the opposite levels of 157.25 and 156.75 can then be expected.
Important: Beginner Forex traders should exercise extreme caution when making entry decisions. Before major fundamental data releases, it is generally best to stay out of the market to avoid sudden exchange-rate fluctuations. If trading during news releases, always use stop-loss orders to minimize losses. Without stop-loss orders, the entire trading account can be depleted very quickly, especially when large position sizes are used without proper money management.
Remember that successful trading requires a clear trading plan, such as the one outlined above. Making spontaneous trading decisions based on current market conditions is an inherently losing strategy for intraday traders.

