
यह भी देखें


 17.11.2026 01:24 PM
Review of Trades and Trading Tips for the Japanese Yen
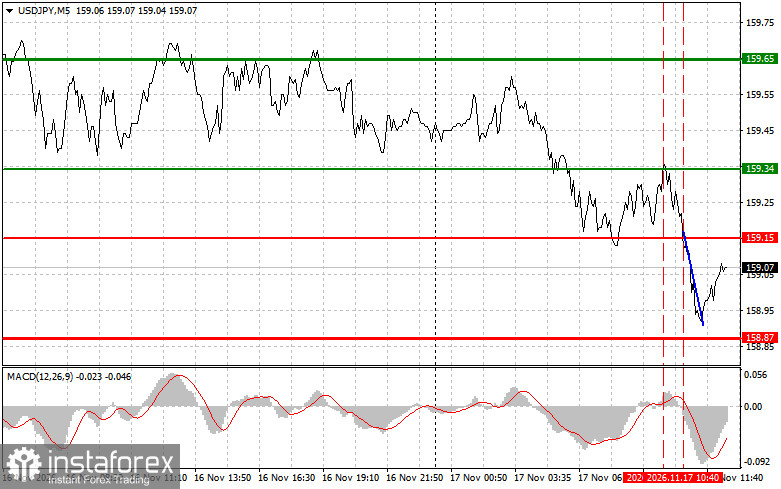
The price test at 159.15 occurred when the MACD indicator had just started moving downward from the zero line, confirming a valid entry point for selling the US dollar. As a result, the pair declined to around 158.90.
Japan's morning economic data came in better than expected, immediately providing support for the yen. The Services Business Activity Index for September came in at 3.50, against a forecast of 0.00, following a previous reading of -4.50. This means the indicator significantly exceeded expectations after its previous decline. These results provide additional arguments for Bank of Japan policymakers who support further interest rate hikes. The current rate stands at 1.25%. It is worth recalling that on October 30, the Bank of Japan kept the rate unchanged in an 8–1 vote, with Takata voting in favor of an increase. Former Bank of Japan Governor Kuroda also stated today that the pace of rate hikes would need to accelerate if inflation intensified.
The US economic calendar looks less eventful in the second half of the day. October industrial production is forecast to remain unchanged at 0.0%, following a 0.7% increase in September, when the figure exceeded the 0.4% forecast and supported the dollar. Manufacturing output is expected to rise by 0.2%, compared with 0.3% previously. Capacity utilization is forecast at 76.8%, following 76.9%, while the NAHB Housing Market Index is expected to remain at 29, unchanged from October, after declining from 32. Retail sales will also be particularly important, with a forecast of 0.1% following a previous reading of 0.8%. However, the key events for the market will be speeches by FOMC members Alberto Musalem and John Williams. The data alone are unlikely to reverse the downward correction in USD/JPY, as the expected readings are weak. However, a hawkish tone from Musalem and Williams could halt the decline and push the pair higher again.
As for the intraday strategy, greater emphasis will be placed on implementing Scenarios #1 and #2.
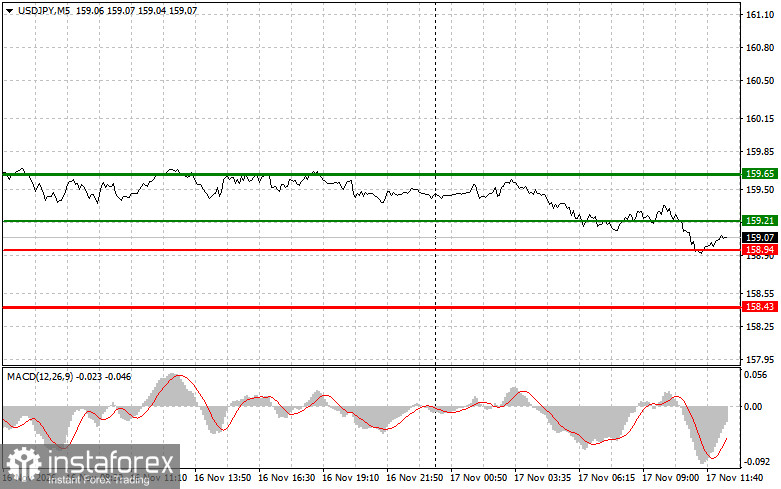
Scenario #1: USD/JPY can be bought today if the price reaches the entry level around 159.21 (the green line on the chart), with a target at 159.65 (the thicker green line on the chart). Around 159.65, the long position can be closed and a short position opened in anticipation of a 30–35-point move in the opposite direction from that level. A rise in the pair can be expected today only if US economic data come in strong. Important! Before buying, make sure that the MACD indicator is above the zero line and has only just started rising from it.
Scenario #2: USD/JPY can also be bought today if the price tests the 158.94 level twice consecutively while the MACD indicator is in the oversold zone. This would limit the pair's downward potential and trigger an upward reversal. A rise toward the opposite levels of 159.21 and 159.65 can then be expected.
Scenario #1: USD/JPY can be sold today after the price breaks below 158.94 (the red line on the chart), which could trigger a rapid decline in the pair. The sellers' key target will be 158.43, where the short position can be closed and a long position opened immediately in the opposite direction, targeting a 20–25-point move upward from that level. Selling pressure on the pair is expected to return today if the central bank intervenes. Important! Before selling, make sure that the MACD indicator is below the zero line and has only just started declining from it.
Scenario #2: USD/JPY can also be sold today if the price tests the 159.21 level twice consecutively while the MACD indicator is in the overbought zone. This would limit the pair's upward potential and trigger a downward reversal. A decline toward the opposite levels of 158.94 and 158.43 can then be expected.
Important. Beginner Forex traders should exercise extreme caution when making entry decisions. It is generally best to stay out of the market ahead of major fundamental data releases to avoid exposure to sharp exchange rate fluctuations. If trading during news releases, always place stop-loss orders to minimize potential losses. Without stop-loss orders, the entire trading account can be depleted very quickly, especially when money management rules are not followed and large position sizes are used.
Remember that successful trading requires a clear trading plan, such as the one presented above. Making spontaneous trading decisions based on current market conditions is a fundamentally unprofitable strategy for intraday traders.

