Double Bottom
was formed on 02.06 at 09:00:13 (UTC+0)
signal strength 3 of 5
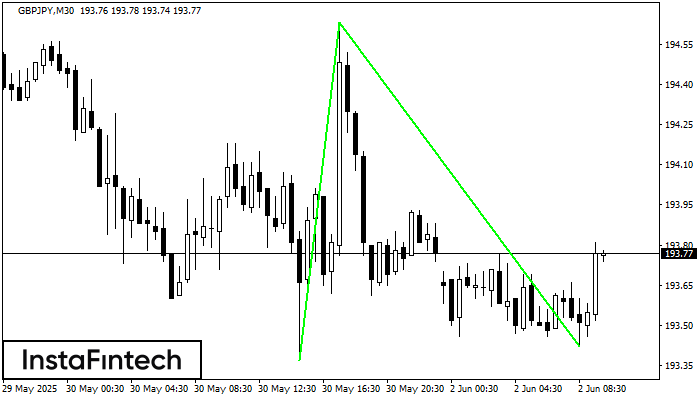
The Double Bottom pattern has been formed on GBPJPY M30. Characteristics: the support level 193.37; the resistance level 194.63; the width of the pattern 126 points. If the resistance level is broken, a change in the trend can be predicted with the first target point lying at the distance of 121 points.
See Also
- All
- All
- Bearish Rectangle
- Bearish Symmetrical Triangle
- Bullish Rectangle
- Double Top
- Double Top
- Triple Bottom
- Triple Bottom
- Triple Top
- Triple Top
- All
- All
- Buy
- Sale
- All
- 1
- 2
- 3
- 4
- 5
बियरिश पताका
was formed on 14.07 at 17:15:37 (UTC+0)
signal strength 2 of 5
बियरिश पताका पैटर्न #NTDOY M15 चार्ट पर बना है। यदि पताका का 21.00 निम्न स्तर टूट जाता है, तो पैटर्न डाउनट्रेंड के जारी रहने का संकेत देता है। अनुशंसाएं: पैटर्न
M5 और M15 समय सीमा में अधिक फाल्स एंट्री पॉइंट्स हो सकते हैं।
Open chart in a new window
बियरिश पताका
was formed on 14.07 at 17:15:23 (UTC+0)
signal strength 2 of 5
बियरिश पताका पैटर्न #NTDOY M15 चार्ट पर बना है। यदि पताका का 21.00 निम्न स्तर टूट जाता है, तो पैटर्न डाउनट्रेंड के जारी रहने का संकेत देता है। अनुशंसाएं: पैटर्न
M5 और M15 समय सीमा में अधिक फाल्स एंट्री पॉइंट्स हो सकते हैं।
Open chart in a new window
बुलिश सिमेट्रिकल त्रिभुज
was formed on 14.07 at 15:30:47 (UTC+0)
signal strength 5 of 5
D1 के चार्ट के अनुसार, #TSLA से बुलिश सिमेट्रिकल त्रिभुज पैटर्न बना। विवरण: यह एक ट्रेंड जारी रहने का पैटर्न है। 367.40 और 269.16 क्रमशः ऊपरी और निचली सीमाओं के
Open chart in a new window