Double Top
was formed on 06.06 at 08:50:51 (UTC+0)
signal strength 1 of 5
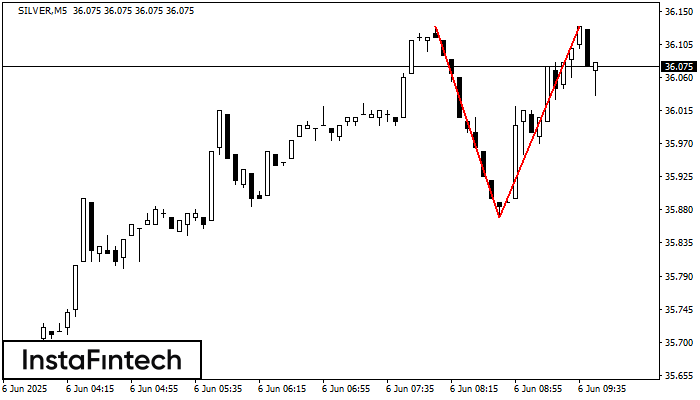
On the chart of SILVER M5 the Double Top reversal pattern has been formed. Characteristics: the upper boundary 36.13; the lower boundary 35.87; the width of the pattern 260 points. The signal: a break of the lower boundary will cause continuation of the downward trend targeting the 35.85 level.
The M5 and M15 time frames may have more false entry points.
See Also
- All
- All
- Bearish Rectangle
- Bearish Symmetrical Triangle
- Bullish Rectangle
- Double Top
- Double Top
- Triple Bottom
- Triple Bottom
- Triple Top
- Triple Top
- All
- All
- Buy
- Sale
- All
- 1
- 2
- 3
- 4
- 5
इन्वर्स हेड एण्ड शोल्डर्स
was formed on 13.08 at 06:32:14 (UTC+0)
signal strength 2 of 5
M15 के अनुसार, AUDCHF तकनीकी पैटर्न - इन्वर्स हेड एण्ड शोल्डर्स को आकार दे रहा है। यदि नेकलाइन 0.5268/0.5268 टूट जाती है, तो इंस्ट्रूमेंट के 0.5290 की ओर बढ़ने की
M5 और M15 समय सीमा में अधिक फाल्स एंट्री पॉइंट्स हो सकते हैं।
Open chart in a new window
डबल टॉप
was formed on 13.08 at 05:10:23 (UTC+0)
signal strength 1 of 5
GBPJPY M5 के चार्ट पर डबल टॉप रीवर्सल पैटर्न बना है। विशेषताएं: ऊपरी सीमा 199.94; निचली सीमा 199.85; पैटर्न की चौड़ाई 9 पॉइंट्स। संकेत: निचली सीमा के टूटने से 199.70
M5 और M15 समय सीमा में अधिक फाल्स एंट्री पॉइंट्स हो सकते हैं।
Open chart in a new window
बुलिश आयत
was formed on 13.08 at 04:21:48 (UTC+0)
signal strength 1 of 5
M5 के चार्ट के अनुसार, NZDCAD से बुलिश आयत बना जो एक प्रवृत्ति निरंतरता का पैटर्न है। पैटर्न निम्न सीमाओं के भीतर समाहित है: निचली सीमा 0.8188 – 0.8188
M5 और M15 समय सीमा में अधिक फाल्स एंट्री पॉइंट्स हो सकते हैं।
Open chart in a new window