Double Bottom
was formed on 06.06 at 10:30:27 (UTC+0)
signal strength 1 of 5
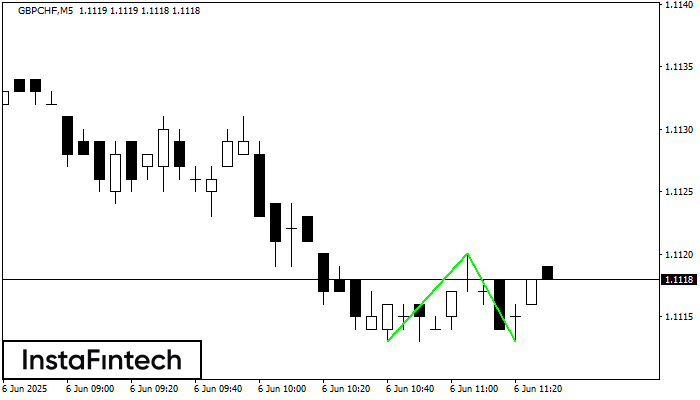
The Double Bottom pattern has been formed on GBPCHF M5; the upper boundary is 1.1120; the lower boundary is 1.1113. The width of the pattern is 7 points. In case of a break of the upper boundary 1.1120, a change in the trend can be predicted where the width of the pattern will coincide with the distance to a possible take profit level.
The M5 and M15 time frames may have more false entry points.
See Also
- All
- All
- Bearish Rectangle
- Bearish Symmetrical Triangle
- Bullish Rectangle
- Double Top
- Double Top
- Triple Bottom
- Triple Bottom
- Triple Top
- Triple Top
- All
- All
- Buy
- Sale
- All
- 1
- 2
- 3
- 4
- 5
डबल बॉटम
was formed on 11.08 at 15:45:16 (UTC+0)
signal strength 1 of 5
डबल बॉटम पैटर्न NZDCAD M5 पर बना है। विशेषताएं: समर्थन स्तर 0.8167; प्रतिरोध स्तर 0.8174; पैटर्न की चौड़ाई 7 पॉइंट्स। यदि प्रतिरोध स्तर टूट जाता है, तो रुझान में बदलाव
M5 और M15 समय सीमा में अधिक फाल्स एंट्री पॉइंट्स हो सकते हैं।
Open chart in a new window
बियरिश फ्लैग
was formed on 11.08 at 14:14:37 (UTC+0)
signal strength 1 of 5
बियरिश फ्लैग पैटर्न NZDUSD पर M5 पर बना है। पैटर्न की निचली सीमा 0.5922/0.5928 पर स्थित है जबकि ऊपरी सीमा 0.5926/0.5932 पर स्थित है। फ्लैगपोल का प्रक्षेपण 13 पॉइंट्स है।
M5 और M15 समय सीमा में अधिक फाल्स एंट्री पॉइंट्स हो सकते हैं।
Open chart in a new window
बियरिश पताका
was formed on 11.08 at 14:14:32 (UTC+0)
signal strength 1 of 5
बियरिश पताका पैटर्न NZDUSD M5 चार्ट पर बना है। यह मौजूदा ट्रेंड कि संभावित निरंतरता का संकेत देता है। निर्दिष्टीकरण: पैटर्न का नीचल स्तर 0.5922 पर है; फ्लैगपोल की ऊंचाई
M5 और M15 समय सीमा में अधिक फाल्स एंट्री पॉइंट्स हो सकते हैं।
Open chart in a new window