Прямоугольник
сформирован 02.06 в 13:16:37 (UTC+0)
сила сигнала 1 из 5

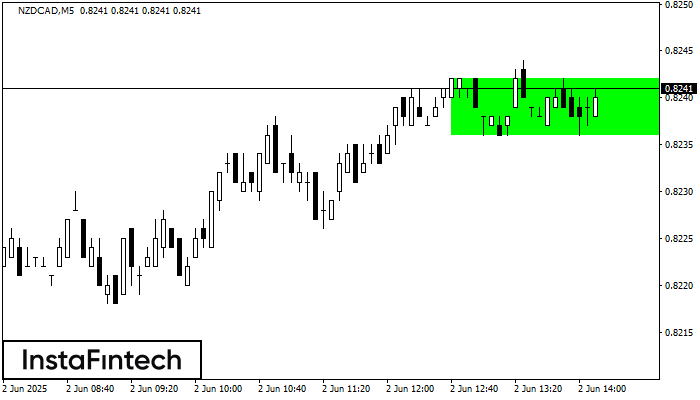
Сформирована фигура «Прямоугольник» на графике NZDCAD M5. Тип фигуры: Продолжение тренда; Границы: Верхняя 0.8242, Нижняя 0.8236; Сигнал: позицию на покупку следует открывать выше верхней границы прямоугольника 0.8242.
Таймфреймы М5 и М15 могут иметь больше ложных точек входа.
- Все
- Все
- Bearish Rectangle
- Bearish Symmetrical Triangle
- Bullish Rectangle
- Double Top
- Double Top
- Triple Bottom
- Triple Bottom
- Triple Top
- Triple Top
- Все
- Все
- Покупка
- Продажа
- Все
- 1
- 2
- 3
- 4
- 5
Double Bottom
was formed on 19.09 at 04:40:24 (UTC+0)
signal strength 1 of 5
The Double Bottom pattern has been formed on GBPCHF M5; the upper boundary is 1.0739; the lower boundary is 1.0731. The width of the pattern is 8 points. In case
The M5 and M15 time frames may have more false entry points.
Open chart in a new window
Triple Top
was formed on 19.09 at 01:30:38 (UTC+0)
signal strength 1 of 5
The Triple Top pattern has formed on the chart of the AUDJPY M5. Features of the pattern: borders have an ascending angle; the lower line of the pattern
The M5 and M15 time frames may have more false entry points.
Open chart in a new window
Triple Bottom
was formed on 19.09 at 00:31:35 (UTC+0)
signal strength 3 of 5
The Triple Bottom pattern has been formed on AUDUSD M30. It has the following characteristics: resistance level 0.6660/0.6624; support level 0.6615/0.6609; the width is 45 points. In the event
Open chart in a new window